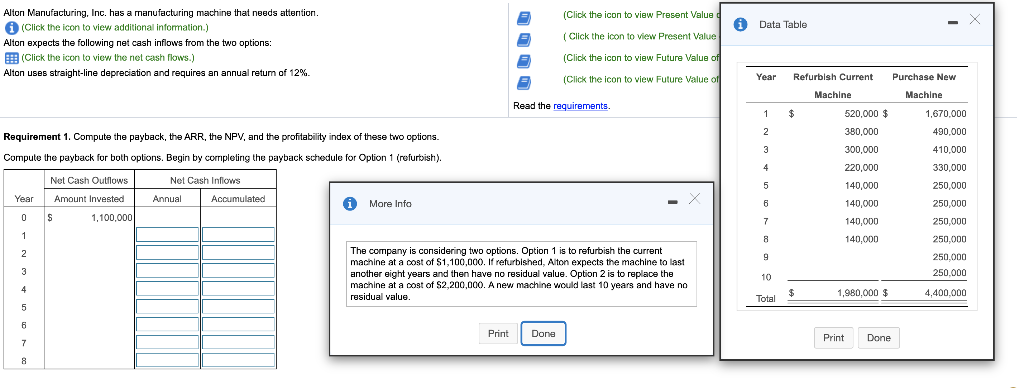
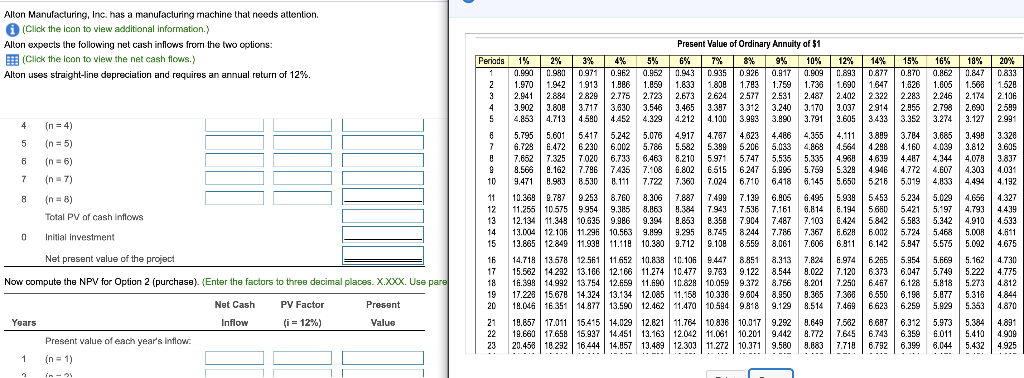
(Click the icon to view Present Value Data Table Alton Manufacturing, Inc. has a manufacturing machine that needs attention. (Click the icon to view additional information.) Alton expects the following net cash inflows from the two options: (Click the icon to view the net cash flows.) Alton uses straight-line depreciation and requires an annual retum of 12%. (Click the icon to view Present Value (Click the icon to view Future Value of (Click the icon to view Future Value of Year Refurbish Current Purchase New Machine Machine Read the requirements. 1 $ 520,000 $ 380,000 1,670.000 490.000 2 Requirement 1. Compute the payback, the ARR, the NPV, and the profitability index of these two options. Compute the payback for both options. Begin by completing the payback schedule for Option 1 (rofurtish). 3 300,000 220,000 4 Net Cash Inflows Nel Cash Outflows Amount Invested 410,000 330.000 250,000 250,000 5 140,000 Year Annual Accumulated i More Info 6 140,000 0 S 1,100,000 7 140,000 250,000 1 8 140,000 250.000 2 9 The company is considering two options. Option 1 is to refurbish the current machine at a cost of $1,100,000. If refurbished, Alton expects the machine to last another eight years and then have no residual value. Option 2 is to replace the machine at a cost of $2,200,000. A new machine would last 10 years and have no residual value. 250.000 250,000 3 10 4 $ 1,980,000 $ 4,400.000 Total on 6 Print Done Print Done 7 8 Present Value of $1 Alton expects the following net cash inflows from the two options: (Click the icon to view the net cash flows.) Alton uses straight-line depreciation and requires an annual return of 12%. Periods 1 2 1% 0.990 0.980 0.971 0.961 0.951 2% 0.980 0.961 0.942 0.924 0.906 3% 0.971 0.943 0.915 0.888 0.863 4% 0.962 0.925 0.889 0.855 0.822 5% 0.952 0.907 0.864 0.823 0.784 6% 0.943 0.890 0.840 0.792 0.747 7% 0.935 0.873 0.816 0.763 0.713 8% 0.926 0.857 0.794 0.735 0.681 9% 0.917 0.842 0.772 0.708 0.650 10% 0.909 0.826 0.751 0.683 0.621 12% 0.893 0.797 0.712 0.636 0.567 14% 0.877 0.769 0.675 0.592 0.519 15% 0.870 0.756 0.658 0.572 0.497 16% 0.862 0.743 0.641 0.552 0.476 18% 0.847 0.718 0.609 0.516 0.437 20% 0.833 0.694 0.579 0.482 0.402 4 5 The payback for Option 1 (refurbish current machine) is years. Now complete the payback schedule for Option 2 (purchase). 6 7 8 9 10 0.942 0.933 0.923 0.914 0.905 0.888 0.871 0.853 0.837 0.820 0.837 0.813 0.789 0.766 0.744 0.790 0.760 0.731 0.703 0.676 0.746 0.711 0.677 0.645 0.614 0.705 0.665 0.627 0.592 0.558 0.666 0.623 0.582 0.544 0.508 0.630 0.583 0.540 0.500 0.463 0.596 0.547 0.502 0.460 0.422 0.564 0.513 0.467 0.424 0.386 0.507 0.452 0.404 0.361 0.322 0.456 0.400 0.351 0.308 0.270 0.432 0.376 0.327 0.284 0.247 0.410 0.354 0.305 0.263 0.227 0.370 0.314 0.266 0.225 0.191 0.335 0.279 0.233 0.194 0.162 Net Cash Outflows Net Cash Inflows Year Amount Invested Annual Accumulated 0 $ 2,200,000 11 12 13 14 15 0.896 0.887 0.879 0.870 0.861 0.804 0.788 0.773 0.758 0.743 0.722 0.701 0.681 0.661 0.642 0.650 0.625 0.601 0.577 0.555 0.585 0.557 0.530 0.505 0.481 0.527 0.497 0.469 0.442 0.417 0.475 0.444 0.415 0.388 0.362 0.429 0.397 0.368 0.340 0.315 0.388 0.356 0.326 0.299 0.275 0.350 0.319 0.290 0.263 0.239 0.287 0.257 0.229 0.205 0.183 0.237 0.208 0.182 0.160 0.140 0.215 0.187 0.163 0.141 0.123 0.195 0.168 0.145 0.125 0.108 0.162 0.137 0.116 0.099 0.084 0.135 0.112 0.093 0.078 0.065 1 2 3 4 16 17 18 19 20 0.853 0.844 0.836 0.828 0.820 0.728 0.714 0.700 0.686 0.673 0.623 0.605 0.587 0.570 0.554 0.534 0.513 0.494 0.475 0.456 0.458 0.436 0.416 0.396 0.377 0.394 0.371 0.350 0.331 0.312 0.339 0.317 0.296 0.277 0.258 0.292 0.270 0.250 0.232 0.215 0.252 0.231 0.212 0.194 0.178 0.218 0.198 0.180 0.164 0.149 0.163 0.146 0.130 0.116 0.104 0.123 0.108 0.095 0.083 0.073 0.107 0.093 0.081 0.070 0.061 0.093 0.080 0.069 0.060 0.051 0.071 0.060 0.051 0.043 0.037 0.054 0.045 0.038 0.031 0.026 5 6 21 22 23 0.811 0.803 0.795 0.660 0.647 0.634 0.538 0.522 0.507 0.439 0.422 0.406 0.359 0.342 0.326 0.294 0.278 0.262 0.242 0.226 0.211 0.199 0.184 0.170 0.164 0.150 0.138 0.135 0.123 0.112 0.093 0.083 0.074 0.064 0.056 0.049 0.053 0.046 0.040 0.044 0.038 0.033 0.031 0.026 0.022 0.022 0.018 0.015 7 8 Print Done The payback for Option 2 (purchase new machine) is years. Compute the ARR (accounting rate of return) for each of the options. ARR Refurbish % Purchase % Compute the NPV for each of the options. Begin with Option 1 (refurbish). (Enter the factors to three decimal places. X.XXX. Use parentheses or a minus sign for a negative net present value.) Net Cash PV Factor Present Years Inflow (i = 12%) Value 1 2 Present value of each year's inflow: (n = 1) (n = 2) (n = 3) (n = 4) 3 4 Alton Manufacturing, Inc. has a manufacturing machine that needs attention. (Click the icon to view additional information.) Alton expects the following net cash inflows from the two options E: (Click the icon to view the net cash flows.) Alton uses straight-line depreciation and requires an annual return of 12%. 16% Periods 1 2 3 4 5 12% 14% 0.893 0877 1.690 1.647 2.402 2.322 3.037 2914 3.605 3.433 4 (n = 4) 15% 0.970 1.326 2.283 2.955 3.352 3.784 4.160 4.487 4.772 5.019 18% 20% 0.862 0.847 0.838 1.605 1.583 1.528 2.246 2.174 2.106 2.798 2.690 2599 3.274 3.127 2.991 3.885 3.499 3.328 4.039 3.812 3.635 4.344 4.078 3.837 4.607 4.303 4.031 4,833 4.494 4.192 8 5 7 6 7 in = 5) (n=6) (n=7) 4.111 4.564 4.980 5.328 5.650 3.899 4.298 4639 4.946 5216 9 10 8 (n = 8) Total PV of cash inflows 11 12 13 14 15 Present Value of Ordinary Annuity of 51 1% 2% 3% 4% 5% 6% 7% 8% 9% 10% (1.990 0.971 0.962 0.952 0.943 0.935 0.926 0.917 (1.909 1.970 1.942 1.913 1.986 1.859 1.833 1.800 1.703 1.759 1.733 2.941 2.884 2829 2.775 2.723 2.673 2624 2.577 2.531 2.487 3.902 3.809 3.717 3.546 3.465 3 397 3.240 3.170 4.853 4.713 4.580 4.452 4.329 4.329 4.212 4.100 3.993 3.890 3.791 5.795 5.601 5.417 5.242 5.076 4.917 4.787 4.823 4.486 4.355 6.728 6.472 6.230 6.002 5.786 5.582 5.389 5.206 5.033 4.868 7.662 7.325 7,020 6.733 6.463 5.210 5.971 5.747 5.535 5.335 8.568 9.162 7.796 7.435 7.108 6.802 6.515 6.247 5.995 5.759 9.471 8.983 8.530 8111 7.722 7.363 7.024 6.710 6.418 6.145 10.3689.787 9253 8.760 8.306 7.887 7.499 7.139 6.805 6.495 11.255 10.575 9.954 9.385 8.863 7.943 7.536 7.161 6.814 12.134 11.349 10.635 | 9.986 9.394 9.853 8.358 7.904 7.904 7.487 7.103 13.004 12.106 | 11.296 10.563 9.899 9.295 8.745 8.244 7.786 7.367 13.865 12.849 11.938 11.119 10.380 3.712 9.108 8.556 8.061 7.603 14.718 13.578 12.561 11.652 10.838 10.106 9.447 8.851 8.313 7.824 15.562 14.292 13.166 12.166 11.274 10.4779.753 9.122 8.544 9.022 16.398 14.992 13.754 12.659 11.090 10.828 10.059 9.372 8.756 8.201 17.228 15.67 14.324 13.134 12.065 11.158 10.336 9.604 8.950 9.365 18.046 16.351 14.877 13.590 12.462 11.470 10.594 9818 9.129 8.514 19.867 17.011 15.415 14.029 12.621 11.764 10.836 10.017 9.252 9.649 19.660 17.658 15.937 14.451 13.163 12.042 11.061 10.201 9.442 8.772 20.453 18292 16.444 14.857 13.489 12.303 11.272 10.371 10.371 9.580 3.883 5.938 6.194 6.424 6.624 6.811 5.453 5.234 5.680 5,421 5842 5.583 6.002 5.724 6.142 5.947 5.029 5,197 5.342 5.468 5.575 4.656 4.793 4.910 5.000 5.002 4.327 4439 4.533 4.511 4.675 0 Initial investment Net present value of the project 6.974 7.120 Now compute the NPV for Option 2 (purchase). (Enter the factors to three decimal places. X.XXX. Use pare 16 17 18 19 20 5.669 5.749 5.818 5.877 5.929 5.973 5.162 5.222 5.273 5.318 5.353 Net Cash PV Factor (i = 12%) 6265 5.954 6.373 6.047 6.467 6.128 6.550 6.198 6.623 6.259 6.697 6.312 6.743 6.359 6.792 6.399 Present Value 4.730 4.775 4.812 4844 4.870 4,891 4.999 4.925 7.338 7.469 7.582 7.645 7.710 Years Inflow 21 22 23 8.011 Present value of each year's Inflow. (n = 1) 5.384 5.410 5.432 - 8.044 1 8 (n = 8) (n = 9) 9 10 (n = 10) Total PV of cash inflows 0 Initial investment Net present value of the project Finally, compute the profitability index for each option. (Round to two decimal places X.XX.) Profitability index Refurbish = Purchase II Requirement 2. Which option should Alton choose? Why? Review your answers in Requirement 1. Alton should choose because this option has a payback period, an ARR that is the other option, a NPV, and its profitability index is Reference Future Value of $1 Periods 1 2 3 4 5 1% 1.010 1.020 1.030 1.041 1.051 2% 1.020 1.040 1.061 1.082 1.104 3% 1.030 1.061 1.093 1.126 1.159 4% 1.040 1.082 1.125 1.170 1.217 5% 1.050 1.103 1.158 1.216 1.276 6% 1.060 1.124 1.191 1.262 1.338 7% 1.070 1.145 1.225 1.311 1.403 8% 1.080 1.166 1.260 1.360 1.469 9% 1.090 1.188 1.295 1.412 1.539 10% 1.100 1.210 1.331 1.464 1.611 12% 1.120 1.254 1.405 1.574 1.762 14% 1.140 1.300 1.482 1.689 1.925 15% 1.150 1.323 1.521 1.749 2.011 6 7 8 9 10 1.062 1.072 1.083 1.094 1.105 1.126 1.149 1.172 1.195 1.219 1.194 1.230 1.267 1.305 1.344 1.265 1.316 1.369 1.423 1.480 1.419 1.504 1.594 1.689 1.791 1.501 1.606 1.718 1.838 1.967 1.587 1.714 1.851 1.999 2.159 1.677 1.828 1.993 2.172 2.367 1.772 1.949 2.144 2.358 2.594 1.974 2.211 2.476 2.773 3.106 2.195 2.502 2.853 3.252 3.707 2.313 2.660 3.059 3.518 4.046 1.340 1.407 1.477 1.551 1.629 1.710 1.796 1.886 1.980 2.079 11 12 13 14 15 1.116 1.127 1.138 1.149 1.161 1.243 1.268 1.294 1.319 1.346 1.384 1.426 1.469 1.513 1.558 1.539 1.601 1.665 1.732 1.801 1.898 2.012 2.133 2.261 2.397 2.105 2.252 2.410 2.579 2.759 2.332 2.518 2.720 2.937 3.172 2.580 2.813 3.066 3.342 3.642 2.853 3.138 3.452 3.798 4.177 3.479 3.896 4.363 4.887 5.474 4.226 4.818 5.492 6.261 7.138 4.652 5.350 6.153 7.076 8.137 16 17 18 19 20 1.173 1.184 1.196 1.208 1.220 1.373 1.400 1.428 1.457 1.486 1.605 1.653 1.702 1.754 1.806 1.873 1.948 2.026 2.107 2.191 2.183 2.292 2.407 2.527 2.653 2.540 2.693 2.854 3.026 3.207 2.952 3.159 3.380 3.617 3.870 3.426 3.700 3.996 4.316 4.661 3.970 4.328 4.717 5.142 5.604 4.595 5.054 5.560 6.116 6.727 6.130 6.866 7.690 8.613 9.646 8.137 9.276 10.58 12.06 13.74 9.358 10.76 12.38 14.23 16.37 21 22 23 1.232 1.245 1.257 1.516 1.546 1.577 1.860 1.916 1.974 2.279 2.370 2.465 2.786 2.925 3.072 3.400 3.604 3.820 4.141 4.430 4.741 5.034 5.437 5.871 6.109 6.659 7.258 7.400 8.140 8.954 10.80 12.10 13.55 15.67 17.86 20.36 18.82 21.64 24.89 Print Done Reference Periods 1 2 3 4 1% 1.000 2.010 3.030 4.060 5.101 2% 1.000 2.020 3.060 4.122 5.204 3% 1.000 2.030 3.091 4.184 5.309 Future Value of Ordinary Annuity of $1 4% 5% 6% 7% 8% 9% 1.000 1.000 1.000 1.000 1.000 1.000 2.040 2.050 2.060 2.070 2.080 2.090 3.122 3.153 3.184 3.215 3.246 3.278 4.246 4.310 4.375 4.440 4.506 4.573 5.416 5.526 5.637 5.751 5.867 5.985 10% 1.000 2.100 3.310 4.641 6.105 12% 1.000 2.120 3.374 4.779 6.353 14% 1.000 2.140 3.440 4.921 6.610 15% 1.000 2.150 3.473 4.993 6.742 5 6 7 8 6.152 7.214 8.286 9.369 10.46 6.308 7.434 8.583 9.755 10.95 6.468 7.662 8.892 10.16 11.46 6.633 7.898 9.214 10.58 12.01 6.802 8.142 9.549 11.03 12.58 6.975 8.394 9.897 11.49 13.18 7.153 8.654 10.260 11.98 13.82 7.336 8.923 10.64 12.49 14.49 7.523 9.200 11.03 13.02 15.19 7.716 9.487 11.44 13.58 15.94 8.115 10.09 12.30 14.78 17.55 8.536 10.73 13.23 16.09 19.34 8.754 11.07 13.73 16.79 20.30 9 10 11 12 13 14 15 11.57 12.68 13.81 14.95 16.10 12.17 13.41 14.68 15.97 17.29 12.81 14.19 15.62 17.09 18.60 13.49 15.03 16.63 18.29 20.02 14.21 15.92 17.71 19.60 21.58 14.97 16.87 18.88 21.02 23.28 15.78 17.89 20.14 22.55 25.13 16.65 18.98 21.50 24.21 27.15 17.56 20.14 22.95 26.02 29.36 18.53 21.38 24.52 27.98 31.77 20.65 24.13 28.03 32.39 37.28 23.04 27.27 32.09 37.58 43.84 24.35 29.00 34.35 40.50 47.58 16 17 18 19 20 17.26 18.43 19.61 20.81 22.02 18.64 20.01 21.41 22.84 24.30 20.16 21.76 23.41 25.12 26.87 21.82 23.70 25.65 27.67 29.78 23.66 25.84 28.13 30.54 33.07 25.67 28.21 30.91 33.76 36.79 27.89 30.84 34.00 37.38 41.00 30.32 33.75 37.45 41.45 45.76 33.00 36.97 41.30 46.02 51.16 35.95 40.54 45.60 51.16 57.28 42.75 48.88 55.75 63.44 72.05 50.98 59.12 68.39 78.97 91.02 55.72 65.08 75.84 88.21 102.4 21 22 23 23.24 24.47 25.72 25.78 27.30 28.85 28.68 30.54 32.45 31.97 34.25 36.62 35.72 38.51 41.43 39.99 43.39 47.00 44.87 49.01 53.44 50.42 55.46 60.89 56.76 62.87 69.53 64.00 71.40 79.54 81.70 92.50 104.6 104.8 120.4 138.3 118.8 137.6 159.3 Print Done