Answered step by step
Verified Expert Solution
Question
1 Approved Answer
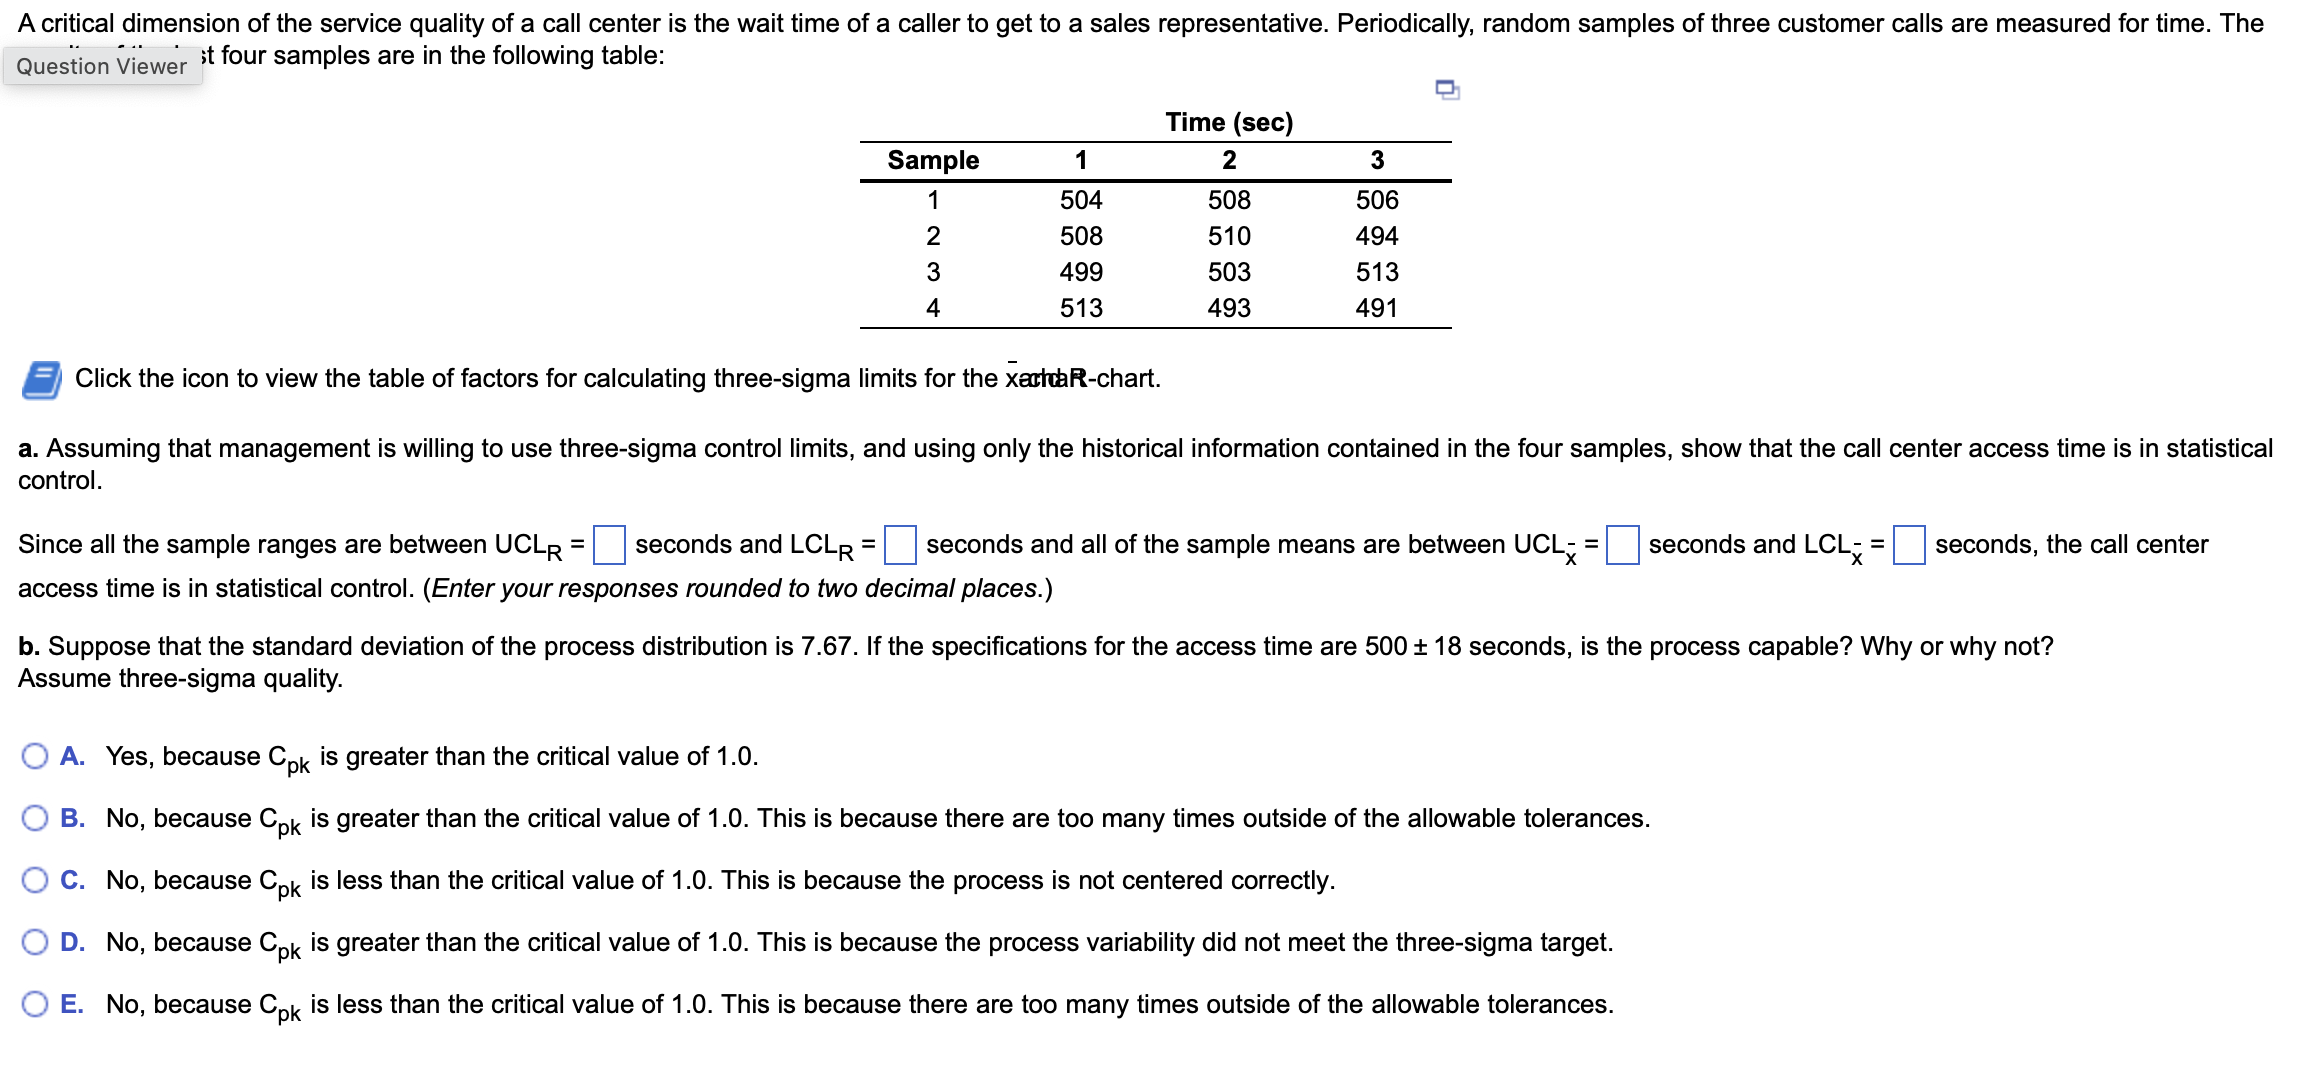
Click the icon to view the table of factors for calculating three-sigma limits for the x-acther-chart. control. access time is in statistical control. (Enter your

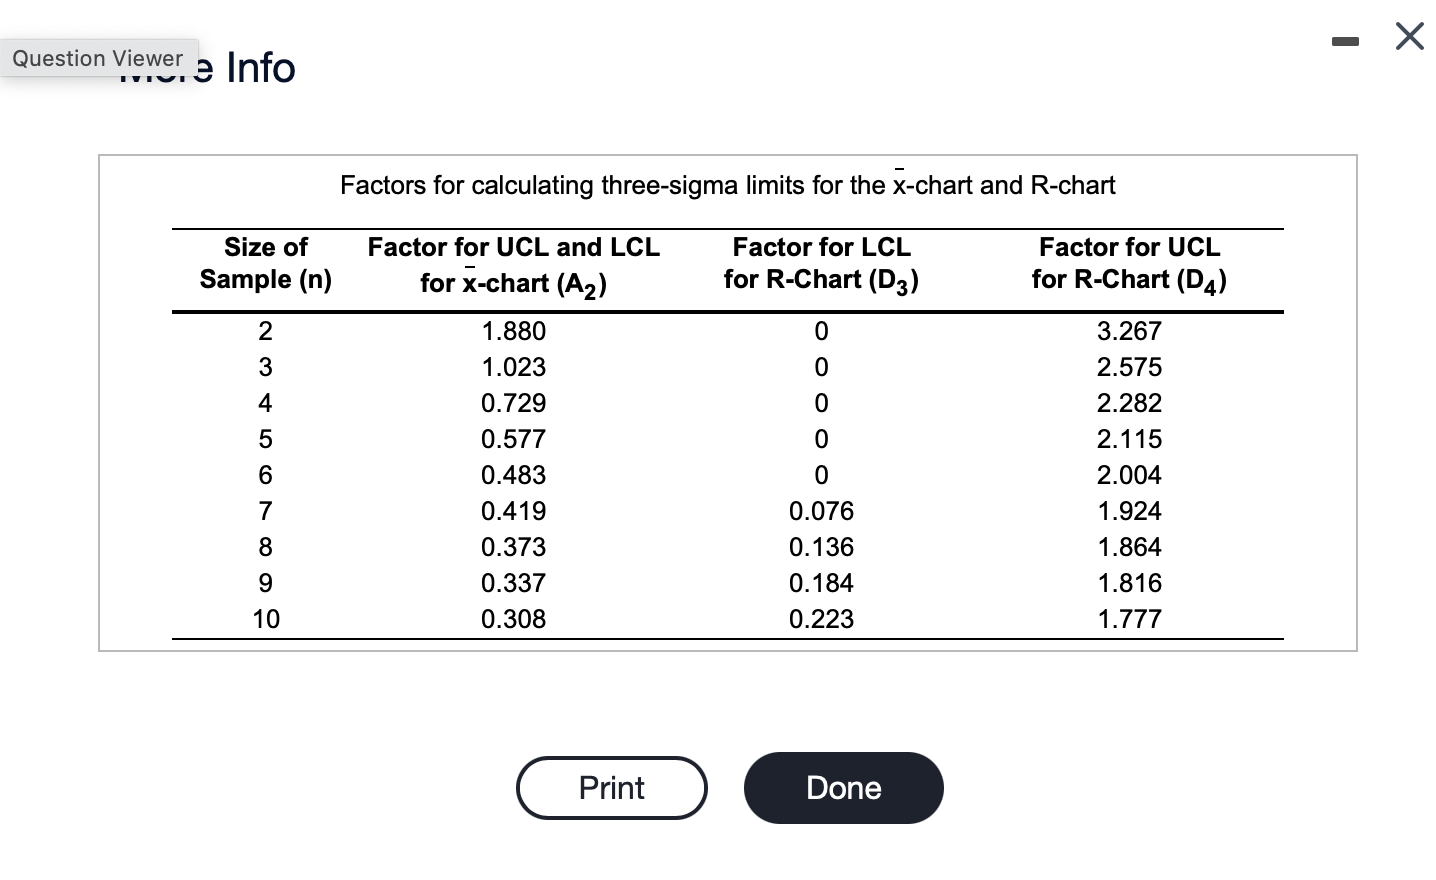
 Click the icon to view the table of factors for calculating three-sigma limits for the x-acther-chart. control. access time is in statistical control. (Enter your responses rounded to two decimal places.) Assume three-sigma quality. A. Yes, because Cpk is greater than the critical value of 1.0 . B. No, because Cpk is greater than the critical value of 1.0. This is because there are too many times outside of the allowable tolerances. C. No, because Cpk is less than the critical value of 1.0. This is because the process is not centered correctly. D. No, because Cpk is greater than the critical value of 1.0. This is because the process variability did not meet the three-sigma target. E. No, because Cpk is less than the critical value of 1.0. This is because there are too many times outside of the allowable tolerances. Factors for calculating three-sigma limits for the x-chart and R-chart
 Step by Step Solution
There are 3 Steps involved in it
Step: 1

Get Instant Access to Expert-Tailored Solutions
See step-by-step solutions with expert insights and AI powered tools for academic success
Step: 2

Step: 3

Ace Your Homework with AI
Get the answers you need in no time with our AI-driven, step-by-step assistance
Get Started


