Question
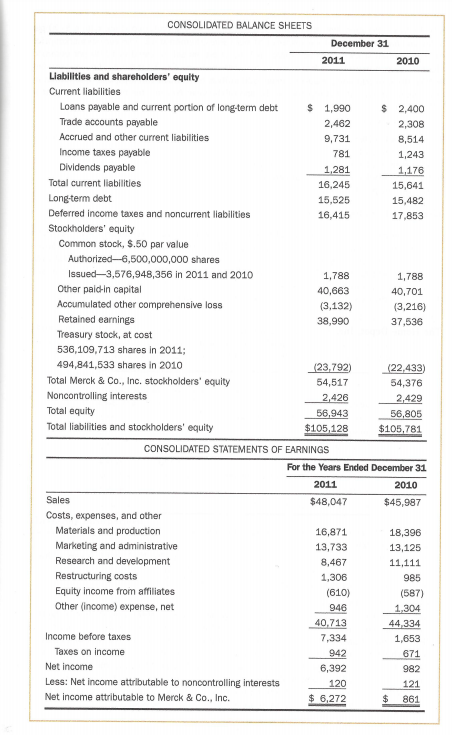
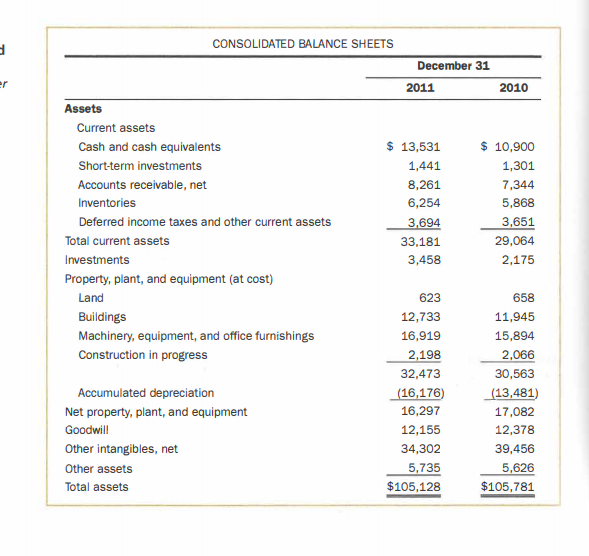
Co., Inc., the global pharmaceutical company, included the income statements and balance sheets in Exhibit 12-12 in its 2011 annual report. Additional information includes the
Co., Inc., the global pharmaceutical company, included the income statements and balance sheets in Exhibit 12-12 in its 2011 annual report. Additional information includes the following:
Average common shares outstanding of 3,071 million in 2011
Market price per share of $37.70 at December 30, 2011, the last trading day before its fiscal year-end of December 31, 2011
Dividends of $1.56 per share were paid on common stock during 2011
Interest expense in 2011 was $749 million
Compute the following ratios for 2011:
1. Current ratio
2. Quick ratio (use current assets - inventories as the numerator)
3. Average collection period (assume all sales are on credit)
4. Total-debt-to-total-assets (define total debt as total liabilities)
5. Total-debt-to-equity (define total debt as total liabilities)
6. Return on common stockholders' equity
7. Gross profit rate
8. Return on sales
9. Total asset turnover
10. Return on assets (defined as EBIT divided by average total assets)
11. EPS (basic)
12. P-E ratio
13. Dividend-yield ratio (for common stock)
14. Dividend-payout ratio (for common stock)
15. Market-to-book value
CONSOLIDATED BALANCE SHEETS December 31 er 2011 2010 Assets Current assets Cash and cash equivalents $ 13,531 $ 10,900 Short-term investments 1,441 1,301 Accounts receivable, net 8,261 7,344 Inventories 6,254 5,868 Deferred income taxes and other current assets 3,694 33,181 3,651 29,064 Total current assets Investments 3,458 2,175 Property, plant, and equipment (at cost) Land 623 658 12,733 11,945 Buildings Machinery, equipment, and office furnishings Construction in progress 16,919 15,894 2,198 32,473 2,066 30,563 Accumulated depreciation Net property, plant, and equipment (16,176) 16,297 (13,481) 17,082 Goodwill 12,155 12,378 Other intangibles, net 34,302 39,456 Other assets 5,735 $105,128 5,626 $105,781 Total assets CONSOLIDATED BALANCE SHEETS December 31 2011 2010 Liabilities and shareholders' equity Current liabilities $ 1,990 $ 2,400 2,308 2,462 Loans payable and current portion of long-term debt Trade accounts payable Accrued and other current liabilities Income taxes payable Dividends payable 9,731 8,514 781 1,243 1,281 1,176 15,641 Total current liabilities 16,245 15,482 15,525 16,415 17,853 Long-term debt Deferred income taxes and noncurrent liabilities Stockholders' equity Common stock, 9.50 par value Authorized-6,500,000,000 shares Issued3,576,948,356 in 2011 and 2010 Other paid-in capital Accumulated other comprehensive loss Retained earnings Treasury stock, at cost 536,109,713 shares in 2011; 1,788 1,788 40,663 40,701 (3,132) (3,216) 38,990 37,536 494,841,533 shares in 2010 (23,792) 54,517 Total Merck & Co., Inc. stockholders' equity Noncontrolling interests Total equity Total liabilities and stockholders' equity 2,426 56,943 $105,128 (22,433) 54,376 2,429 56,805 $105,781 CONSOLIDATED STATEMENTS OF EARNINGS For the Years Ended December 31 2011 2010 Sales $48,047 $45,987 16,871 18,396 Costs, expenses, and other Materials and production Marketing and administrative Research and development 13,733 13,125 8,467 11,111 1,306 985 Restructuring costs Equity income from affiliates (610) (587) Other (income) expense, net 946 40.713 7,334 1,304 44,334 Income before taxes 1,653 Taxes on income 942 671 Net income 6,392 982 120 121 Less: Net income attributable to noncontrolling interests Net income attributable to Merck & Co., Inc. $ 6,272 $ 861Step by Step Solution
There are 3 Steps involved in it
Step: 1
Get Instant Access to Expert-Tailored Solutions
See step-by-step solutions with expert insights and AI powered tools for academic success
Step: 2
Step: 3
Ace Your Homework with AI
Get the answers you need in no time with our AI-driven, step-by-step assistance
Get Started