Code must be written in C# in Visual Studio.
I'm a beginner programmer. Would anyone be able to write this out in the most beginner way possible and include explanations and finished pictures? All help is greatly appreciated! Thank you so much!!!
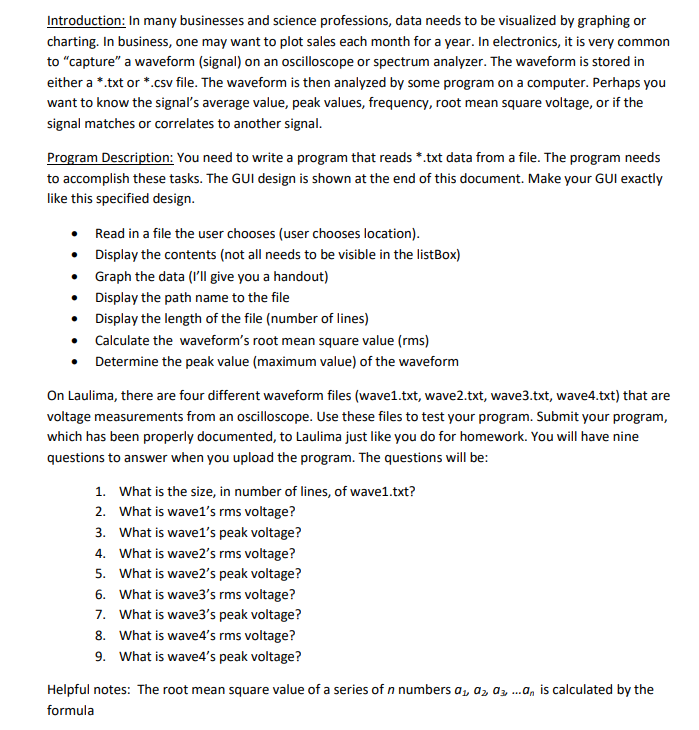
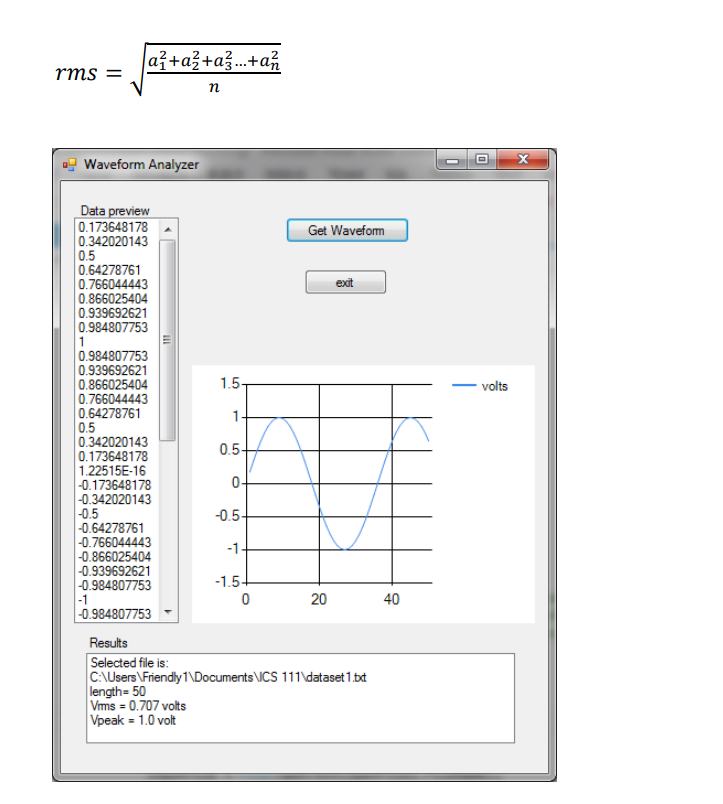
Introduction: In many businesses and science professions, data needs to be visualized by graphing or charting. In business, one may want to plot sales each month for a year. In electronics, it is very common to "capture" a waveform (signal) on an oscilloscope or spectrum analyzer. The waveform is stored in either a .txt or *.csv file. The waveform is then analyzed by some program on a computer. Perhaps you want to know the signal's average value, peak values, frequency, root mean square voltage, or if the signal matches or correlates to another signal Program Description: You need to write a program that reads *.txt data from a file. The program needs to accomplish these tasks. The GUI design is shown at the end of this document. Make your GUI exactly like this specified design . Read in a file the user chooses (user chooses location) . Display the contents (not all needs to be visible in the listBox) . Graph the data (I'll give you a handout) . Display the path name to the file . Display the length of the file (number of lines) Calculate the waveform's root mean square value (rms) . Determine the peak value (maximum value) of the waveform On Laulima, there are four different waveform files (wave1.txt, wave2.txt, wave3.txt, wave4.txt) that are voltage measurements from an oscilloscope. Use these files to test your program. Submit your program, which has been properly documented, to Laulima just like you do for homework. You wil have nine questions to answer when you upload the program. The questions will be 1. 2. 3. 4. 5. 6. 7. 8. 9. What is the size, in number of lines, of wave1.txt? What is wavel's rms voltage? What is wavel's peak voltage? What is wave2's rms voltage? What is wave2's peak voltage? What is wave3's rms voltage? What is wave3's peak voltage? What is wave4's rms voltage? What is wave4's peak voltage? Helpful notes: The root mean square value of a series of n numbers a,, a2 a3, ...an is calculated by the formula Introduction: In many businesses and science professions, data needs to be visualized by graphing or charting. In business, one may want to plot sales each month for a year. In electronics, it is very common to "capture" a waveform (signal) on an oscilloscope or spectrum analyzer. The waveform is stored in either a .txt or *.csv file. The waveform is then analyzed by some program on a computer. Perhaps you want to know the signal's average value, peak values, frequency, root mean square voltage, or if the signal matches or correlates to another signal Program Description: You need to write a program that reads *.txt data from a file. The program needs to accomplish these tasks. The GUI design is shown at the end of this document. Make your GUI exactly like this specified design . Read in a file the user chooses (user chooses location) . Display the contents (not all needs to be visible in the listBox) . Graph the data (I'll give you a handout) . Display the path name to the file . Display the length of the file (number of lines) Calculate the waveform's root mean square value (rms) . Determine the peak value (maximum value) of the waveform On Laulima, there are four different waveform files (wave1.txt, wave2.txt, wave3.txt, wave4.txt) that are voltage measurements from an oscilloscope. Use these files to test your program. Submit your program, which has been properly documented, to Laulima just like you do for homework. You wil have nine questions to answer when you upload the program. The questions will be 1. 2. 3. 4. 5. 6. 7. 8. 9. What is the size, in number of lines, of wave1.txt? What is wavel's rms voltage? What is wavel's peak voltage? What is wave2's rms voltage? What is wave2's peak voltage? What is wave3's rms voltage? What is wave3's peak voltage? What is wave4's rms voltage? What is wave4's peak voltage? Helpful notes: The root mean square value of a series of n numbers a,, a2 a3, ...an is calculated by the formula