Coding Help with Python Please:
Thank you in advance for your help!
This is the question I'd like help with: (Number 3)
Below are Questions 1 and 2 for Reference:
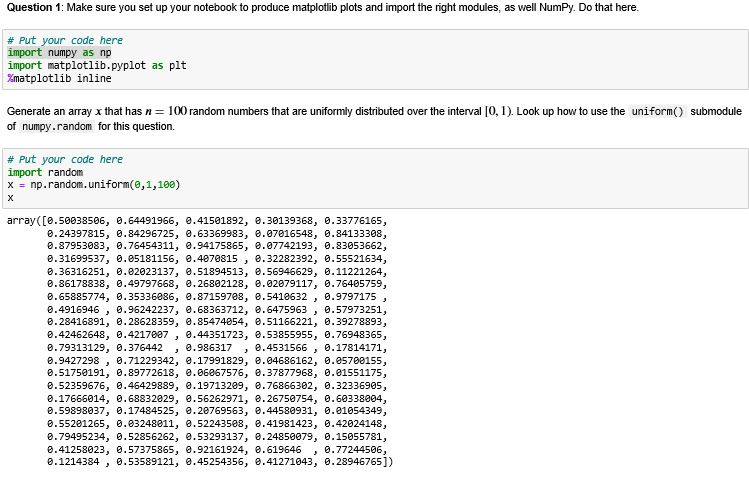
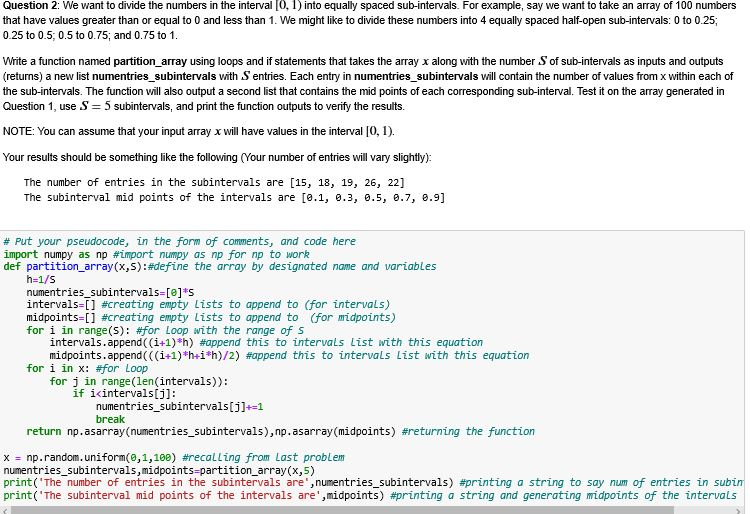
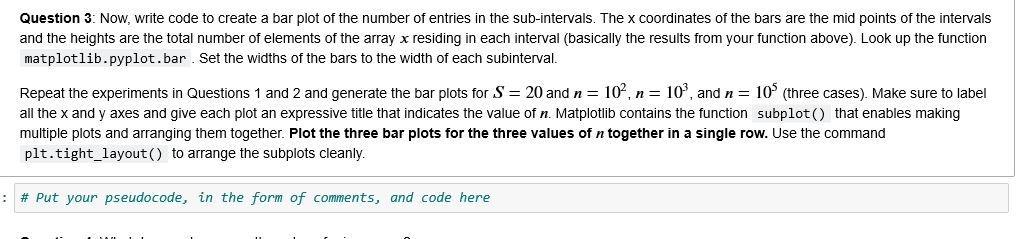
Question 3: Now, write code to create a bar plot of the number of entries in the sub-intervals. The x coordinates of the bars are the mid points of the intervals and the heights are the total number of elements of the array x residing in each interval (basically the results from your function above). Look up the function matplotlib.pyplot.bar . Set the widths of the bars to the width of each subinterval. Repeat the experiments in Questions 1 and 2 and generate the bar plots for S= 20 and n= 102, n = 10', and n = 10 (three cases). Make sure to label all the x and y axes and give each plot an expressive title that indicates the value of n. Matplotlib contains the function subplot() that enables making multiple plots and arranging them together. Plot the three bar plots for the three values of n together in a single row. Use the command plt. tight_layout() to arrange the subplots cleanly. : # Put your pseudocode, in the form of comments, and code here Question 1: Make sure you set up your notebook to produce matplotlib plots and import the right modules, as well NumPy. Do that here. # Put your code here import numpy as np import matplotlib.pyplot as plt matplotlib inline Generate an array x that has n= 100 random numbers that are uniformly distributed over the interval [0,1). Look up how to use the uniform() submodule of numpy.random for this question. # Put your code here import random X = np.random.uniform(0,1,100) array([0.50038506, 0.64491966, 0.41501892, 0.30139368, 0.33776165, 0.24397815, 0.84296725, 0.63369983, 0.07016548, 0.84133308, 8.87953083, 0.76454311, 0.94175865, 0.07742193, 0.83053662, 0.31699537, 0.85181156, 0.4870815, 0.32282392, 0.55521634, 8.36316251, 0.82023137, 0.51894513, 0.56946629, 0.11221264, 8.86178838, 0.49797668, 0.26802128, 8.02879117, 0.76405759, 0.65885774, 0.35336886, 0.87159788, 8.5418632, 0.9797175, 8.4916946, 0.96242237, 0.68363712, 0.6475963, 0.57973251, 0.28416891, 0.28628359, 0.85474054, 0.51166221, 0.39278893, 8.42462648, 0.4217887, 0.44351723, 8.53855955, 0.76948365, 8.79313129, 0.376442 , 0.986317 , 8.4531566, 0.17814171, 8.9427298, 0.71229342, 0.17991829, 8.04686162, 0.85708155, 0.51750191, 0.89772618, 0.06867576, 8.37877968, 0.81551175, 0.52359676, 0.46429889, 0.19713289, 0.76866302, 0.32336905, 8.17666014, 0.68832029, 0.56262971, 8.26750754, 0.60338004, 0.59898037, 0.17484525, 0.28769563, 0.44580931, 0.81054349, 8.55201265, 0.83248211, 0.52243588, 0.41981423, 0.42024148, 0.79495234, 0.52856262, 2.53293137, 0.24850079, 0.15055781, 0.41258023, 0.57375865, 0.92161924, 0.619646 , 0.77244506, 8.1214384, 0.53589121, 0.45254356, 0.41271043, 0.28946765]) Question 2: We want to divide the numbers in the interval (0, 1) into equally spaced sub-intervals. For example, say we want to take an array of 100 numbers that have values greater than or equal to 0 and less than 1. We might like to divide these numbers into 4 equally spaced half-open sub-intervals: 0 to 0.25, 0.25 to 0.5, 0.5 to 0.75, and 0.75 to 1. Write a function named partition_array using loops and if statements that takes the array x along with the number of sub-intervals as inputs and outputs (returns) a new list numentries_subintervals with S entries. Each entry in numentries_subintervals will contain the number of values from x within each of the sub-intervals. The function will also output a second list that contains the mid points of each corresponding sub-interval. Test it on the array generated in Question 1, use S=5 subintervals, and print the function outputs to verify the results. NOTE: You can assume that your input array x will have values in the interval (0,1). Your results should be something like the following (Your number of entries will vary slightly) The number of entries in the subintervals are [15, 18, 19, 26, 22] The subinterval mid points of the intervals are [0.1, 0.3, 0.5, 0.7, 0.9] # Put your pseudocode, in the form of comments, and code here import numpy as np #import numpy as np for np to work def partition_array(x,s):#define the array by designated name and variables h=1/S numentries_subintervals=[@]*S intervals=[] #creating empty Lists to append to (for intervals) midpoints=[] #creating empty Lists to append to (for midpoints) for i in range(s): #for Loop with the range of s intervals.append((i+1)*h) #append this to intervals List with this equation midpoints.append(((i+1)*h+i+h)/2) #append this to intervals List with this equation for i in x: #for Loop for j in range(len(intervals)): if i intervals[i]: numentries_subintervals[j]+=1 break return np.asarray(numentries_subintervals), np.asarray(midpoints) #returning the function X = np.random.uniform(0,1,100) #recalling from Last problem numentries_subintervals, midpoints=partition_array(x,5) print('The number of entries in the subintervals are', numentries_subintervals) #printing a string to say num of entries in subin print('The subinterval mid points of the intervals are', midpoints) #printing a string and generating widpoints of the intervals Question 3: Now, write code to create a bar plot of the number of entries in the sub-intervals. The x coordinates of the bars are the mid points of the intervals and the heights are the total number of elements of the array x residing in each interval (basically the results from your function above). Look up the function matplotlib.pyplot.bar . Set the widths of the bars to the width of each subinterval. Repeat the experiments in Questions 1 and 2 and generate the bar plots for S= 20 and n= 102, n = 10', and n = 10 (three cases). Make sure to label all the x and y axes and give each plot an expressive title that indicates the value of n. Matplotlib contains the function subplot() that enables making multiple plots and arranging them together. Plot the three bar plots for the three values of n together in a single row. Use the command plt. tight_layout() to arrange the subplots cleanly. : # Put your pseudocode, in the form of comments, and code here Question 1: Make sure you set up your notebook to produce matplotlib plots and import the right modules, as well NumPy. Do that here. # Put your code here import numpy as np import matplotlib.pyplot as plt matplotlib inline Generate an array x that has n= 100 random numbers that are uniformly distributed over the interval [0,1). Look up how to use the uniform() submodule of numpy.random for this question. # Put your code here import random X = np.random.uniform(0,1,100) array([0.50038506, 0.64491966, 0.41501892, 0.30139368, 0.33776165, 0.24397815, 0.84296725, 0.63369983, 0.07016548, 0.84133308, 8.87953083, 0.76454311, 0.94175865, 0.07742193, 0.83053662, 0.31699537, 0.85181156, 0.4870815, 0.32282392, 0.55521634, 8.36316251, 0.82023137, 0.51894513, 0.56946629, 0.11221264, 8.86178838, 0.49797668, 0.26802128, 8.02879117, 0.76405759, 0.65885774, 0.35336886, 0.87159788, 8.5418632, 0.9797175, 8.4916946, 0.96242237, 0.68363712, 0.6475963, 0.57973251, 0.28416891, 0.28628359, 0.85474054, 0.51166221, 0.39278893, 8.42462648, 0.4217887, 0.44351723, 8.53855955, 0.76948365, 8.79313129, 0.376442 , 0.986317 , 8.4531566, 0.17814171, 8.9427298, 0.71229342, 0.17991829, 8.04686162, 0.85708155, 0.51750191, 0.89772618, 0.06867576, 8.37877968, 0.81551175, 0.52359676, 0.46429889, 0.19713289, 0.76866302, 0.32336905, 8.17666014, 0.68832029, 0.56262971, 8.26750754, 0.60338004, 0.59898037, 0.17484525, 0.28769563, 0.44580931, 0.81054349, 8.55201265, 0.83248211, 0.52243588, 0.41981423, 0.42024148, 0.79495234, 0.52856262, 2.53293137, 0.24850079, 0.15055781, 0.41258023, 0.57375865, 0.92161924, 0.619646 , 0.77244506, 8.1214384, 0.53589121, 0.45254356, 0.41271043, 0.28946765]) Question 2: We want to divide the numbers in the interval (0, 1) into equally spaced sub-intervals. For example, say we want to take an array of 100 numbers that have values greater than or equal to 0 and less than 1. We might like to divide these numbers into 4 equally spaced half-open sub-intervals: 0 to 0.25, 0.25 to 0.5, 0.5 to 0.75, and 0.75 to 1. Write a function named partition_array using loops and if statements that takes the array x along with the number of sub-intervals as inputs and outputs (returns) a new list numentries_subintervals with S entries. Each entry in numentries_subintervals will contain the number of values from x within each of the sub-intervals. The function will also output a second list that contains the mid points of each corresponding sub-interval. Test it on the array generated in Question 1, use S=5 subintervals, and print the function outputs to verify the results. NOTE: You can assume that your input array x will have values in the interval (0,1). Your results should be something like the following (Your number of entries will vary slightly) The number of entries in the subintervals are [15, 18, 19, 26, 22] The subinterval mid points of the intervals are [0.1, 0.3, 0.5, 0.7, 0.9] # Put your pseudocode, in the form of comments, and code here import numpy as np #import numpy as np for np to work def partition_array(x,s):#define the array by designated name and variables h=1/S numentries_subintervals=[@]*S intervals=[] #creating empty Lists to append to (for intervals) midpoints=[] #creating empty Lists to append to (for midpoints) for i in range(s): #for Loop with the range of s intervals.append((i+1)*h) #append this to intervals List with this equation midpoints.append(((i+1)*h+i+h)/2) #append this to intervals List with this equation for i in x: #for Loop for j in range(len(intervals)): if i intervals[i]: numentries_subintervals[j]+=1 break return np.asarray(numentries_subintervals), np.asarray(midpoints) #returning the function X = np.random.uniform(0,1,100) #recalling from Last problem numentries_subintervals, midpoints=partition_array(x,5) print('The number of entries in the subintervals are', numentries_subintervals) #printing a string to say num of entries in subin print('The subinterval mid points of the intervals are', midpoints) #printing a string and generating widpoints of the intervals