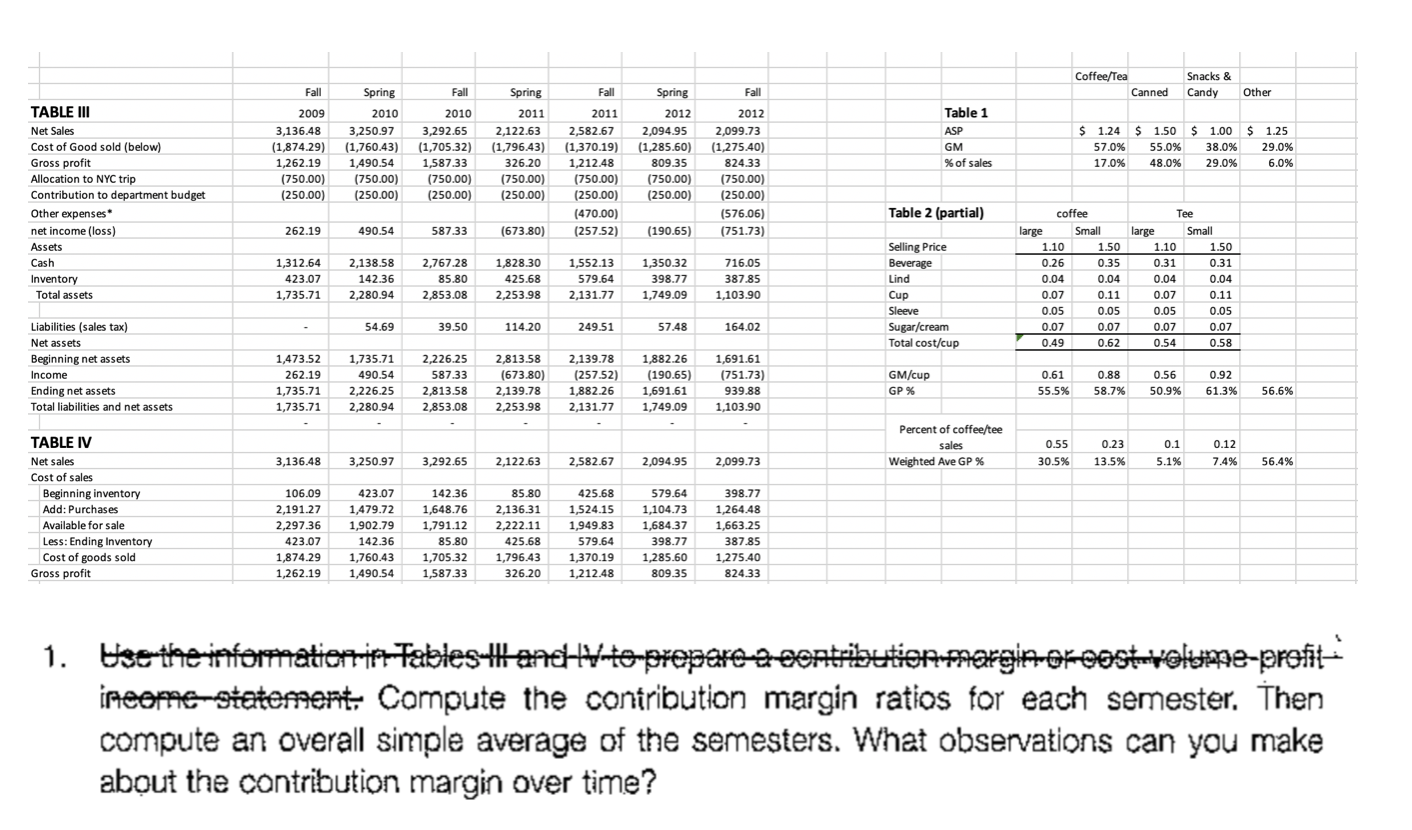
Coffee/Tea Canned Snacks & Candy Fall Fall Other $ $ $ 2009 3,136.48 (1,874.29) 1,262.19 (750.00) (250.00) $ Spring 2010 3,250.97 (1,760.43) 1,490.54 (750.00) (250.00) Fall 2010 3,292.65 (1,705.32) 1,587.33 (750.00) (250.00) Table 1 ASP GM % of sales Spring 2011 2,122.63 (1,796.43) 326.20 (750.00) (250.00) Fall 2011 2,582.67 (1,370.19) 1,212.48 (750.00) (250.00) (470.00) (257.52) Spring 2012 2,094.95 (1,285.60) 809.35 (750.00) (250.00) (250.00) 1.24 57.0% 17.0% 1.50 55.0% 48.0% 1.00 38.0% 29.0% TABLE III Net Sales Cost of Good sold (below) Gross profit Allocation to NYC trip Contribution to department budget Other expenses net income (loss) Assets Cash Inventory Total assets 1.25 29.0% 6.0% 2012 2,099.73 (1,275.40) 824.33 (750.00) (250.00) (576.06) (751.73) Table 2 (partial) 262.19 490.54 587.33 (673.80) (190.65) 2,138.58 1,312.64 423.07 1,735.71 142.36 2,767.28 85.80 2,853.08 1,828.30 1,552.13 1,350.32 425.68579.64398.77 2,253.98 2,131.77 1,749.09 716.05 387.85 1,103.90 coffee large Small 1.10 1.50 0.26 0.35 0.04 0.04 0.07 0.11 0.05 0.05 0.07 0.07 0.49 0.62 Selling Price Beverage Lind Cup Sleeve Sugar/cream Total cost/cup Tee large Small 1.10 1.50 0.31 0.31 0.04 0.04 0.07 0.11 0.05 0.05 0.07 0.07 0.54 0.58 2,280.94 54.69 39.50 114.20 249.51 5 7.48 164.02 Liabilities (sales tax) Net assets Beginning net assets Income Ending net assets Total liabilities and net assets 1,473.52 262.19 1,735.71 1,735.71 1,735.71 490.54 2,226.25 2,280.94 2,226.25 587.33 2,813.58 2,853.08 2,813.58 (673.80) 2,139.78 2,253.98 2,139.78 (257.52) 1.882.26 2,131.77 1,882.26 (190.65) 1.691.61 1,749.09 1,691.61 (751.73) 939.88 1,103.90 GM/cup GP % 0.61 55.5% 0.88 58.7% 0.56 50.9% 0.92 61.3% 56.6% Percent of coffee/tee sales Weighted Ave GP % 0.55 30.5% 0.23 13.5% 0.1 5.1% 0.12 7.4% 3,136.48 3,250.97 3,292.65 2,122.63 2,582.67 2,094.95 2,099.73 56.4% 142.36 85.80 TABLE IV Net sales Cost of sales Beginning inventory Add: Purchases Available for sale Less: Ending Inventory Cost of goods sold Gross profit 106.09 2,191.27 2,297.36 423.07 1,874.29 1,262.19 423.07 1,479.72 1,902.79 142.36 1,760.43 1,490.54 1,791.12 85.80 1,705.32 1,587.33 2,222.11 425.68 1,796.43 326.20 425.68 579.64 398.77 1.524.151.104 72126AAO 1,949.83 1,684.37 1,663.25 579.64 398.77 387.85 ,370.19 1,285.60 1,275.40 1,212.48 809.35 824.33 1 1. Use the informatierrin Fables and to prepare a contribution margin okost volume-profiti income-statement Compute the contribution margin ratios for each semester. Then compute an overall simple average of the semesters. What observations can you make about the contribution margin over time? Coffee/Tea Canned Snacks & Candy Fall Fall Other $ $ $ 2009 3,136.48 (1,874.29) 1,262.19 (750.00) (250.00) $ Spring 2010 3,250.97 (1,760.43) 1,490.54 (750.00) (250.00) Fall 2010 3,292.65 (1,705.32) 1,587.33 (750.00) (250.00) Table 1 ASP GM % of sales Spring 2011 2,122.63 (1,796.43) 326.20 (750.00) (250.00) Fall 2011 2,582.67 (1,370.19) 1,212.48 (750.00) (250.00) (470.00) (257.52) Spring 2012 2,094.95 (1,285.60) 809.35 (750.00) (250.00) (250.00) 1.24 57.0% 17.0% 1.50 55.0% 48.0% 1.00 38.0% 29.0% TABLE III Net Sales Cost of Good sold (below) Gross profit Allocation to NYC trip Contribution to department budget Other expenses net income (loss) Assets Cash Inventory Total assets 1.25 29.0% 6.0% 2012 2,099.73 (1,275.40) 824.33 (750.00) (250.00) (576.06) (751.73) Table 2 (partial) 262.19 490.54 587.33 (673.80) (190.65) 2,138.58 1,312.64 423.07 1,735.71 142.36 2,767.28 85.80 2,853.08 1,828.30 1,552.13 1,350.32 425.68579.64398.77 2,253.98 2,131.77 1,749.09 716.05 387.85 1,103.90 coffee large Small 1.10 1.50 0.26 0.35 0.04 0.04 0.07 0.11 0.05 0.05 0.07 0.07 0.49 0.62 Selling Price Beverage Lind Cup Sleeve Sugar/cream Total cost/cup Tee large Small 1.10 1.50 0.31 0.31 0.04 0.04 0.07 0.11 0.05 0.05 0.07 0.07 0.54 0.58 2,280.94 54.69 39.50 114.20 249.51 5 7.48 164.02 Liabilities (sales tax) Net assets Beginning net assets Income Ending net assets Total liabilities and net assets 1,473.52 262.19 1,735.71 1,735.71 1,735.71 490.54 2,226.25 2,280.94 2,226.25 587.33 2,813.58 2,853.08 2,813.58 (673.80) 2,139.78 2,253.98 2,139.78 (257.52) 1.882.26 2,131.77 1,882.26 (190.65) 1.691.61 1,749.09 1,691.61 (751.73) 939.88 1,103.90 GM/cup GP % 0.61 55.5% 0.88 58.7% 0.56 50.9% 0.92 61.3% 56.6% Percent of coffee/tee sales Weighted Ave GP % 0.55 30.5% 0.23 13.5% 0.1 5.1% 0.12 7.4% 3,136.48 3,250.97 3,292.65 2,122.63 2,582.67 2,094.95 2,099.73 56.4% 142.36 85.80 TABLE IV Net sales Cost of sales Beginning inventory Add: Purchases Available for sale Less: Ending Inventory Cost of goods sold Gross profit 106.09 2,191.27 2,297.36 423.07 1,874.29 1,262.19 423.07 1,479.72 1,902.79 142.36 1,760.43 1,490.54 1,791.12 85.80 1,705.32 1,587.33 2,222.11 425.68 1,796.43 326.20 425.68 579.64 398.77 1.524.151.104 72126AAO 1,949.83 1,684.37 1,663.25 579.64 398.77 387.85 ,370.19 1,285.60 1,275.40 1,212.48 809.35 824.33 1 1. Use the informatierrin Fables and to prepare a contribution margin okost volume-profiti income-statement Compute the contribution margin ratios for each semester. Then compute an overall simple average of the semesters. What observations can you make about the contribution margin over time


