Answered step by step
Verified Expert Solution
Question
1 Approved Answer
Coke Pepsi Evaluate the liquidity (ability to meet short-term obligations) of these companies by calculating the current and quick ratios, by averaging their rests over
 Coke
Coke

Pepsi

Evaluate the liquidity (ability to meet short-term obligations) of these companies by calculating the current and quick ratios, by averaging their rests over the past 3 years. Make your comments from the perspective of a supplier or banker.
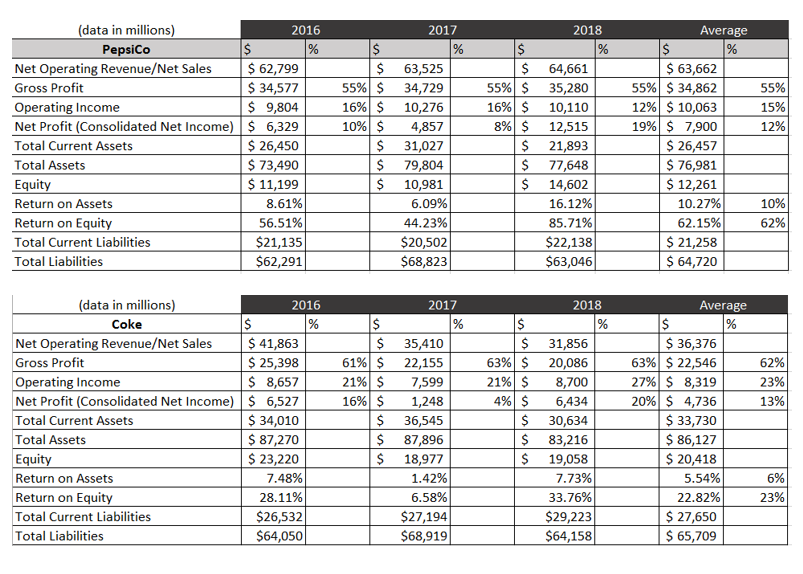
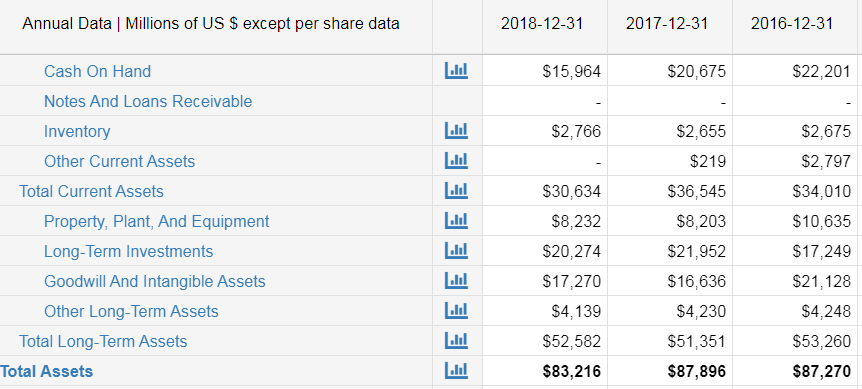
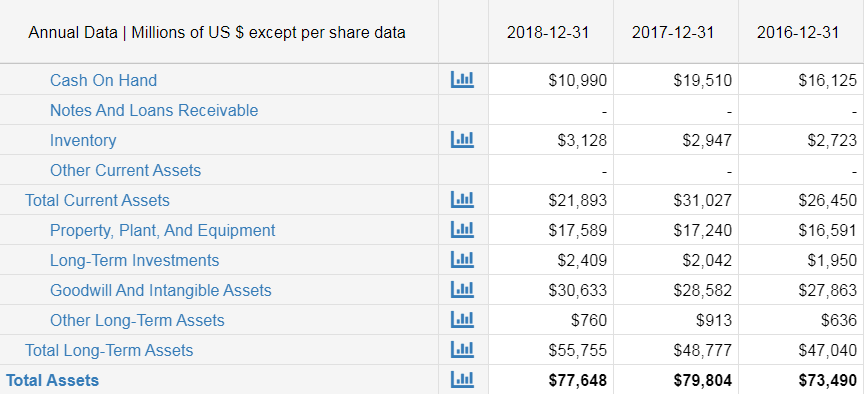
(data in millions) Pepsico Net Operating Revenue/Net Sales 2016 2017 Average 2018 $ 62,799 $ 34,577 $ 9,804 Net Profit (Consolidated Net Income) $ 6,329 $ 26,450 $ 73,490 $ 11,199 $ 63,662 55% $ 34,862 12% $ 10,063 19% $ 7,900 $ 26,457 $ 76,981 $ 12,261 63,525 64,661 Gross Profit 55% $ 55% $ 55% 34,729 35,280 Operating Income 16% $ 10% $ 16% $ 10,276 4,857 31,027 79,804 10,110 12,515 15% 8% $ 12% 21,893 77,648 14,602 Total Current Assets Total Assets Equity Return on Assets Return on Equity Total Current Liabilities 10,981 8.61% 6.09% 16.12% 10.27% 10% 44.23% 85.71% 62.15% 56.51% 62% $20,502 $68,823 $22,138 $63,046 $ 21,258 $ 64,720 $21,135 Total Liabilities $62,291 (data in millions) 2016 2017 2018 Average Coke Net Operating Revenue/Net Sales $ 41,863 $ 25,398 $ 8,657 Net Profit (Consolidated Net Income) $ 6,527 $ 34,010 $ 87,270 $ 23,220 7.48% $ 36,376 63% $ 22,546 27% $ 8,319 20% $ 4,736 $ 33,730 $ 86,127 $ 20,418 35,410 22,155 7,599 1,248 36,545 31,856 61% $ 21% $ 63% $ 21% $ Gross Profit 62% 20,086 8,700 Operating Income 23% 16% $ 4% $ 6,434 13% Total Current Assets Total Assets 30,634 87,896 83,216 Equity Return on Assets Return on Equity 18,977 19,058 1.42% 7.73% 5.54% 6% 6.58% 33.76% 22.82% 23% 28.11% $29,223 $64,158 $26,532 $64,050 $ 27,650 $ 65,709 Total Current Liabilities $27,194 $68,919 Total Liabilities %24 Annual Data | Millions of US $ except per share data 2018-12-31 2017-12-31 2016-12-31 Cash On Hand Lll $15,964 $20,675 $22,201 Notes And Loans Receivable $2,766 $2,655 Inventory $2,675 Llul $219 $2,797 Other Current Assets Llul Total Current Assets $30,634 $34,010 $36,545 $8,232 $8,203 $10,635 Property, Plant, And Equipment $20,274 $17,249 Long-Term Investments $21,952 $17,270 $16,636 Goodwill And Intangible Assets $21,128 Llul Other Long-Term Assets $4,139 $4,230 $4,248 Llul Total Long-Term Assets $52,582 $53,260 $51,351 $83,216 $87,896 $87,270 Total Assets Annual Data | Millions of US $ except per share data 2018-12-31 2016-12-31 2017-12-31 Cash On Hand Lal $10,990 $19,510 $16,125 Notes And Loans Receivable Lll $3,128 Inventory $2,947 $2,723 Other Current Assets Lll $31,027 $21,893 $26,450 Total Current Assets $17,589 $17,240 $16,591 Property, Plant, And Equipment Llal $2,409 $1,950 Long-Term Investments $2,042 Lll $30,633 $28,582 $27,863 Goodwill And Intangible Assets Lal $760 $913 $636 Other Long-Term Assets Llul $48,777 $47,040 Total Long-Term Assets $55,755 Llal $77,648 $79,804 $73,490 Total AssetsStep by Step Solution
There are 3 Steps involved in it
Step: 1

Get Instant Access to Expert-Tailored Solutions
See step-by-step solutions with expert insights and AI powered tools for academic success
Step: 2

Step: 3

Ace Your Homework with AI
Get the answers you need in no time with our AI-driven, step-by-step assistance
Get Started


