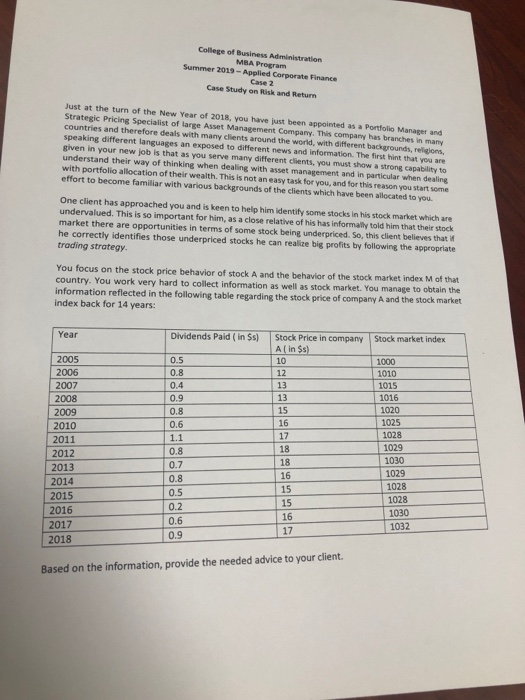
College of Business Administration. MBA Program Summer 2019-Applied Corporate Finance Case 2 Case Study on Risk and Return Just at the turn of the New Year of 2018, you have just been appointed as a Portfolio Manager and Strategic Pricing Specialist of large Asset Management Company. This company has branches in many countries and therefore deals with many clients around the world, with different backgrounds, religions, speaking different languages an exposed to different news and information. The first hint that you are given in your new job is that as you serve many different clients, you must show a strong capability to understand their way of thinking when dealing with asset management and in particular when dealing with portfolio allocation of their wealth. This is not an easy task for you, and for this reason you start some effort to become familiar with various backgrounds of the clients which have been allocated to you. One client has approached you and is keen to help him identify some stocks in his stock market which are undervalued. This is so important for him, as a close relative of his has informally told him that their stock market there are opportunities in terms of some stock being underpriced. So, this client believes that i he correctly identifies those underpriced stocks he can realize big profits by following the appropriate trading strategy. You focus on the stock price behavior of stock A and the behavior of the stock market index M of that country. You work very hard to collect information as well as stock market. You manage to obtain the information reflected in the following table regarding the stock price of company A and the stock market index back for 14 years: Year Dividends Paid ( in $s) Stock Price in company Al in $s) Stock market index 2005 0.5 10 1000 0.8 2006 12 1010 13 2007 0.4 1015 0.9 13 1016 2008 0.8 15 1020 2009 16 1025 0.6 2010 1028 17 1.1 2011 1029 18 0.8 2012 1030 18 0.7 2013 1029 16 0.8 2014 1028 15 0.5 2015 1028 15 0.2 2016 1030 16 0.6 2017 1032 17 0.9 2018 Based on the information, provide the needed advice to your client


