

Question
Comment on the performance of Sunny Resort. (hints: identify the departments and areas that Sunny Resort is performing not as good as its comp set;
 Comment on the performance of Sunny Resort. (hints: identify the departments and areas that Sunny Resort is performing not as good as its comp set; suggest reasons and recommend strategies for improvement; provide support to your answer e.g. relevant ratios/indicators/percentage etc)
PLEASE I NEED THIS URGENTLY
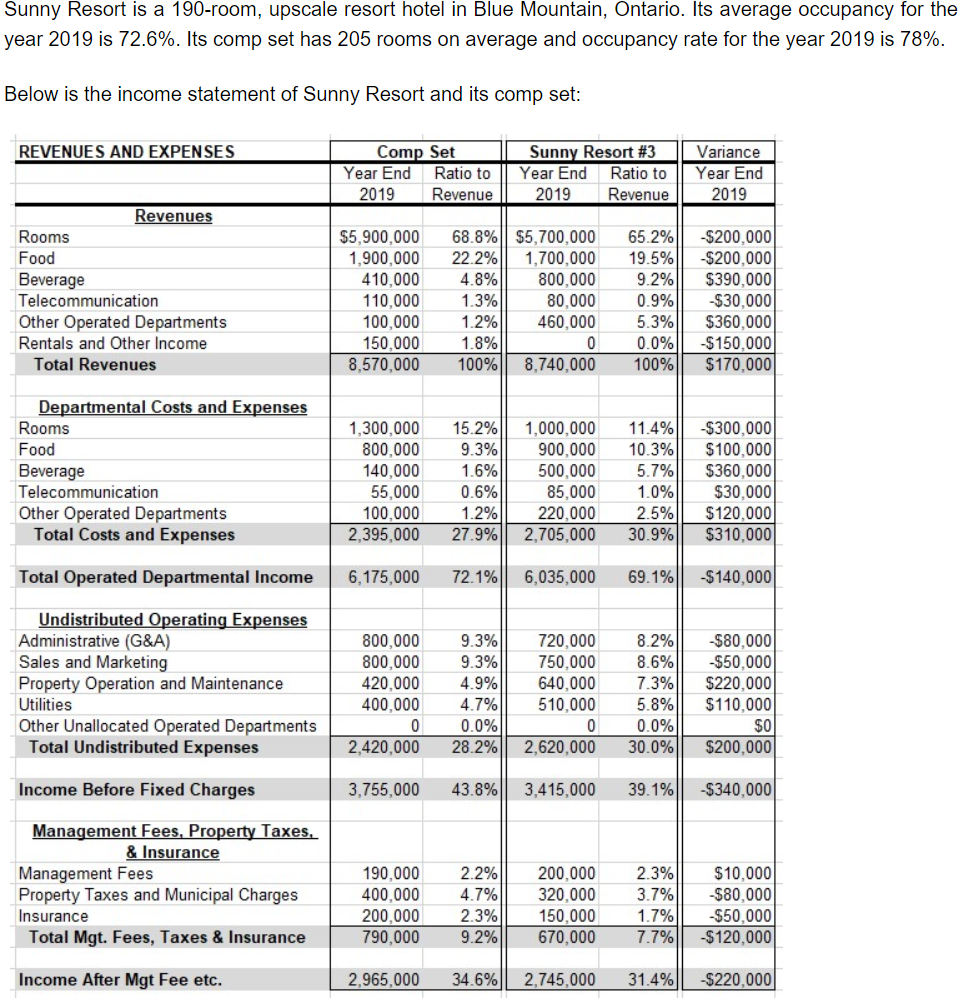
Sunny Resort is a 190-room, upscale resort hotel in Blue Mountain, Ontario. Its average occupancy for the year 2019 is 72.6%. Its comp set has 205 rooms on average and occupancy rate for the year 2019 is 78%. Below is the income statement of Sunny Resort and its comp set: REVENUES AND EXPENSES Comp Set Year End Ratio to 2019 Revenue Sunny Resort #3 Year End Ratio to 2019 Revenue Variance Year End 2019 Revenues Rooms Food Beverage Telecommunication Other Operated Departments Rentals and Other Income Total Revenues $5,900,000 1,900,000 410,000 110,000 100.000 150,000 8,570,000 68.8%|| $5,700,000 22.2% 1,700,000 4.8% 800,000 1.3% 80.000 1.2% 460,000 1.8% 0 100% 8.740.000 65.2% 19.5% 9.2% 0.9% 5.3% 0.0% 100% $200,000 -$200,000 $390,000 -$30,000 $360,000 -$150,000 $170.000 Departmental Costs and Expenses Rooms Food Beverage Telecommunication Other Operated Departments Total Costs and Expenses 1,300,000 800,000 140,000 55,000 100,000 2,395,000 15.2% 9.3% 1.6% 0.6% 1.2% 27.9% 1,000,000 900,000 500.000 85,000 220,000 2.705.000 11.4% 10.3% 5.7% 1.0% 2.5% 30.9% -$300,000 $100,000 $360,000 $30,000 $120.000 $310.000 Total Operated Departmental Income 6,175,000 72.1% 6,035,000 69.1% -$140,000 Undistributed Operating Expenses Administrative (G&A) Sales and Marketing Property Operation and Maintenance Utilities Other Unallocated Operated Departments Total Undistributed Expenses 800,000 800,000 420,000 400,000 0 2,420,000 9.3% 9.3% 4.9% 4.7% 0.0% 28.2% 720,000 750,000 640,000 510,000 0 2.620.000 8.2% 8.6% 7.3% 5.8% 0.0% 30.0% -$80,000 -$50,000 $220.000 $110,000 $0 $200,000 Income Before Fixed Charges 3,755,000 43.8% 3,415,000 39.1% -$340,000 Management Fees, Property Taxes, & Insurance Management Fees Property Taxes and Municipal Charges Insurance Total Mgt. Fees, Taxes & Insurance 190,000 400,000 200.000 790,000 2.2% 4.7% 2.3% 9.2% 200,000 320,000 150,000 670,000 2.3% 3.7% 1.7% 7.7% $10,000 $80.000 -$50,000 -$120,000 Income After Mgt Fee etc. 2,965,000 34.6% 2,745,000 31.4% -$220,000 Sunny Resort is a 190-room, upscale resort hotel in Blue Mountain, Ontario. Its average occupancy for the year 2019 is 72.6%. Its comp set has 205 rooms on average and occupancy rate for the year 2019 is 78%. Below is the income statement of Sunny Resort and its comp set: REVENUES AND EXPENSES Comp Set Year End Ratio to 2019 Revenue Sunny Resort #3 Year End Ratio to 2019 Revenue Variance Year End 2019 Revenues Rooms Food Beverage Telecommunication Other Operated Departments Rentals and Other Income Total Revenues $5,900,000 1,900,000 410,000 110,000 100.000 150,000 8,570,000 68.8%|| $5,700,000 22.2% 1,700,000 4.8% 800,000 1.3% 80.000 1.2% 460,000 1.8% 0 100% 8.740.000 65.2% 19.5% 9.2% 0.9% 5.3% 0.0% 100% $200,000 -$200,000 $390,000 -$30,000 $360,000 -$150,000 $170.000 Departmental Costs and Expenses Rooms Food Beverage Telecommunication Other Operated Departments Total Costs and Expenses 1,300,000 800,000 140,000 55,000 100,000 2,395,000 15.2% 9.3% 1.6% 0.6% 1.2% 27.9% 1,000,000 900,000 500.000 85,000 220,000 2.705.000 11.4% 10.3% 5.7% 1.0% 2.5% 30.9% -$300,000 $100,000 $360,000 $30,000 $120.000 $310.000 Total Operated Departmental Income 6,175,000 72.1% 6,035,000 69.1% -$140,000 Undistributed Operating Expenses Administrative (G&A) Sales and Marketing Property Operation and Maintenance Utilities Other Unallocated Operated Departments Total Undistributed Expenses 800,000 800,000 420,000 400,000 0 2,420,000 9.3% 9.3% 4.9% 4.7% 0.0% 28.2% 720,000 750,000 640,000 510,000 0 2.620.000 8.2% 8.6% 7.3% 5.8% 0.0% 30.0% -$80,000 -$50,000 $220.000 $110,000 $0 $200,000 Income Before Fixed Charges 3,755,000 43.8% 3,415,000 39.1% -$340,000 Management Fees, Property Taxes, & Insurance Management Fees Property Taxes and Municipal Charges Insurance Total Mgt. Fees, Taxes & Insurance 190,000 400,000 200.000 790,000 2.2% 4.7% 2.3% 9.2% 200,000 320,000 150,000 670,000 2.3% 3.7% 1.7% 7.7% $10,000 $80.000 -$50,000 -$120,000 Income After Mgt Fee etc. 2,965,000 34.6% 2,745,000 31.4% -$220,000Step by Step Solution
There are 3 Steps involved in it
Step: 1

Get Instant Access to Expert-Tailored Solutions
See step-by-step solutions with expert insights and AI powered tools for academic success
Step: 2

Step: 3
Ace Your Homework with AI
Get the answers you need in no time with our AI-driven, step-by-step assistance
Get Started
Personal Finance
Authors: McGraw Hill
Student Edition
0078958393, 978-0078958397