Common Size Analysis for the following Microsoft stock data:


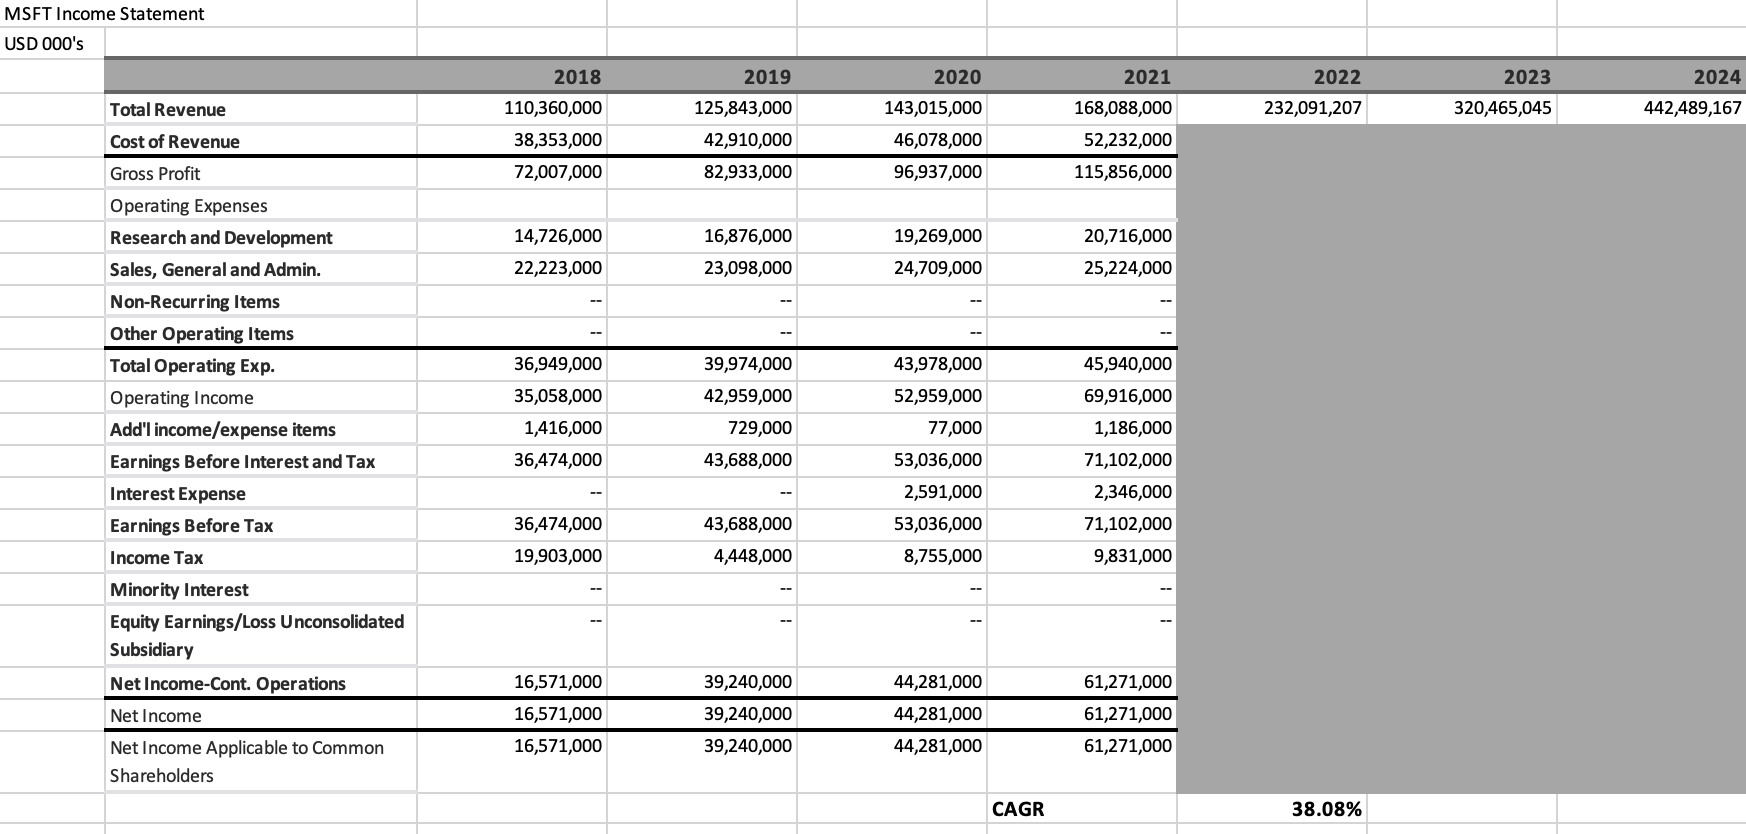
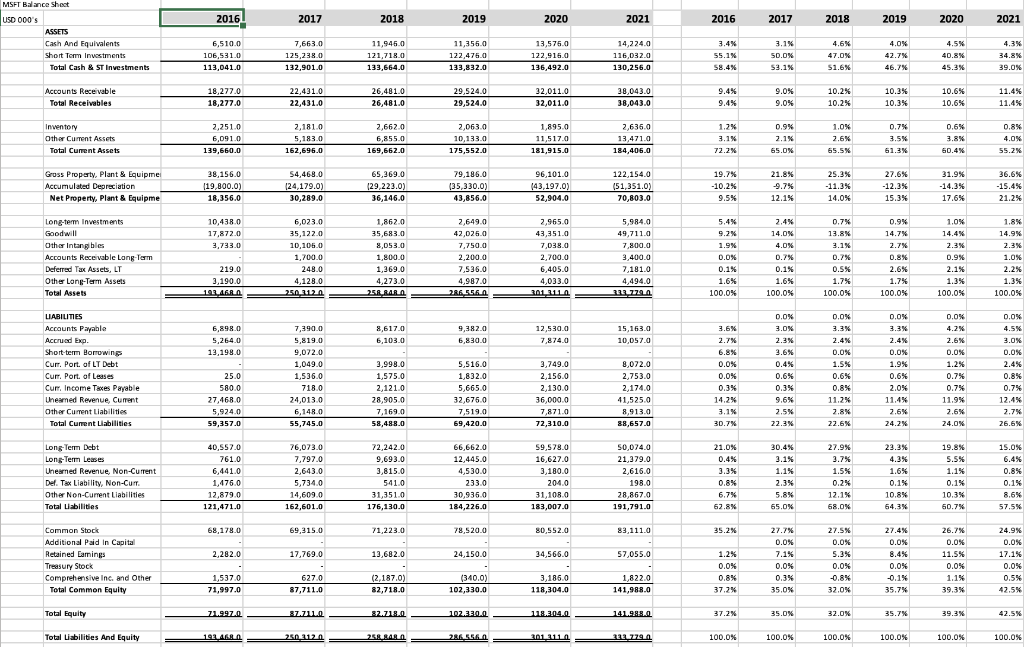
MSFT Income Statement USD 000's 2018 2022 232,091,207 2023 320,465,045 2024 442,489,167 Total Revenue 2019 125,843,000 42,910,000 82,933,000 110,360,000 38,353,000 72,007,000 2020 143,015,000 46,078,000 96,937,000 2021 168,088,000 52,232,000 115,856,000 Cost of Revenue Gross Profit 14,726,000 16,876,000 23,098,000 19,269,000 24,709,000 20,716,000 25,224,000 22,223,000 36,949,000 35,058,000 1,416,000 36,474,000 39,974,000 42,959,000 729,000 43,688,000 Operating Expenses Research and Development Sales, General and Admin. Non-Recurring Items Other Operating Items Total Operating Exp. Operating Income Add'l income/expense items Earnings Before Interest and Tax Interest Expense Earnings Before Tax Income Tax Minority Interest Equity Earnings/Loss Unconsolidated Subsidiary Net Income-Cont. Operations Net Income Net Income Applicable to Common Shareholders 43,978,000 52,959,000 77,000 53,036,000 2,591,000 53,036,000 8,755,000 45,940,000 69,916,000 1,186,000 71,102,000 2,346,000 71,102,000 9,831,000 36,474,000 19,903,000 43,688,000 4,448,000 16,571,000 16,571,000 16,571,000 39,240,000 39,240,000 39,240,000 44,281,000 44,281,000 44,281,000 61,271,000 61,271,000 61,271,000 CAGR 38.08% 2016 2017 2018 2020 2021 4% 1.6% ON 15 say BE 9 Cash And Equivalent Short Tom investime Investments Total Cash & ST Investments Accounts Receivable Total Receivables 9.4% 10.2% 1.05 Invento Other Cument Assets Total Current Asset 72 65. 65. 61. 60 27.6% Gross Property. Plant & Equipme Accumulated Depreciation Net Property, Plant & Equipme BE ze= UN % OM X 3 PORN Long-term Investment Goodwill Other Intang bles e Long Tam De Other Long-Term Assets Total Assets ONS 3% NO NPN 8.99 00 .00 100 100 0.0 LIABILITIES Accounts Payabil Accruce Baco Cure Port of Debt Curr. Port of Leases Curr.Income Taxes Payable www Total Current Liabilities OOO NOPO 0.0% SONS 0.8 . .7% 0% ,3% 2x .7% POOLS NODO 59 30.75 24 2% 26. 4% %% Long Term Debt Long-Term Lesses Unearned Revenue, Non-Current bella Lality, Non-Curr Total abilities 21 2.0% 3.3% 0.8% 62.8% 1.1% 2. avio yooo AN * 10.3% 54.38 OK 12 35.2% 27.7 NO Additional Paid in Capital Retained Earnings Treasury Stock Total Common Equity 1.2% 0.0% 37.2% 7.1% 0.0% 35.0% OS 68 MOOO OOOO Total Equity 37.2% 35.0% 32.0% 35.7% 39.3% 42.5% Total Liabilities And Equity 100.0% 100.0% % 100.0% 100.0% 100.0%


