- Common Size Analysis for the Income Statement only for the last year.
- Profitability Analysis:
- ROA.
- Profit Margin.
- Assets Turnover.
- ROCE Analysis
- ROCE.
- CEL.
- CSL.
- Risk Analysis:
- Quick Ratio (Acid Test Ratio).
- Working capital Activity ratio.
- Long-Term Solvency Risk- Debt Ratios:
- L.T. Debt Ratio.
- Debt/Equity Ratio.
- L.T. Debt/Asset Ratio.
- Multiple Discriminant Analysis:
- Altman's Z-Score.
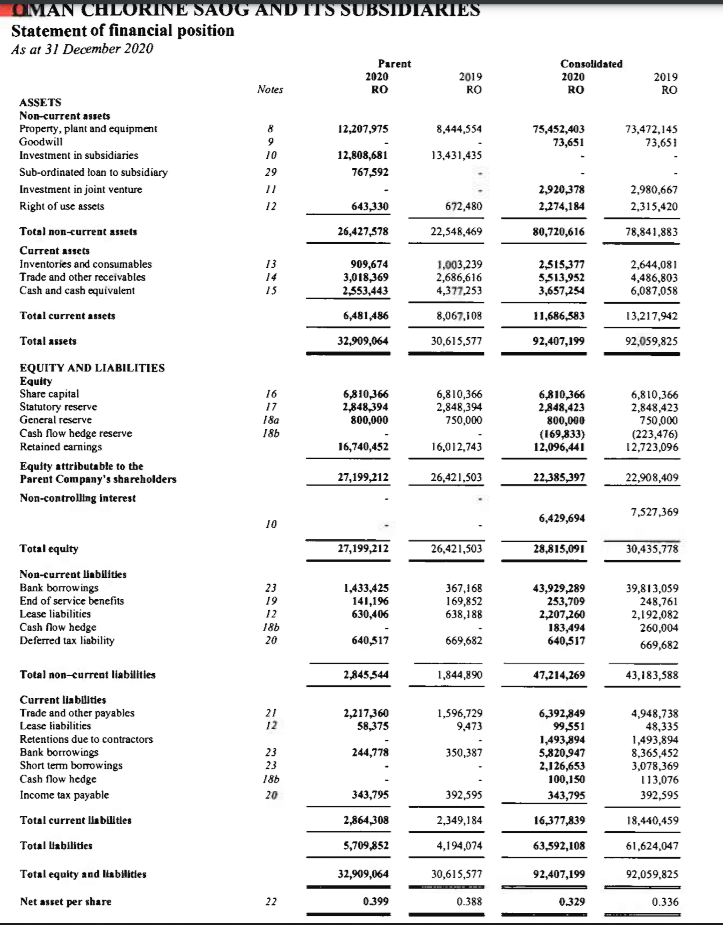
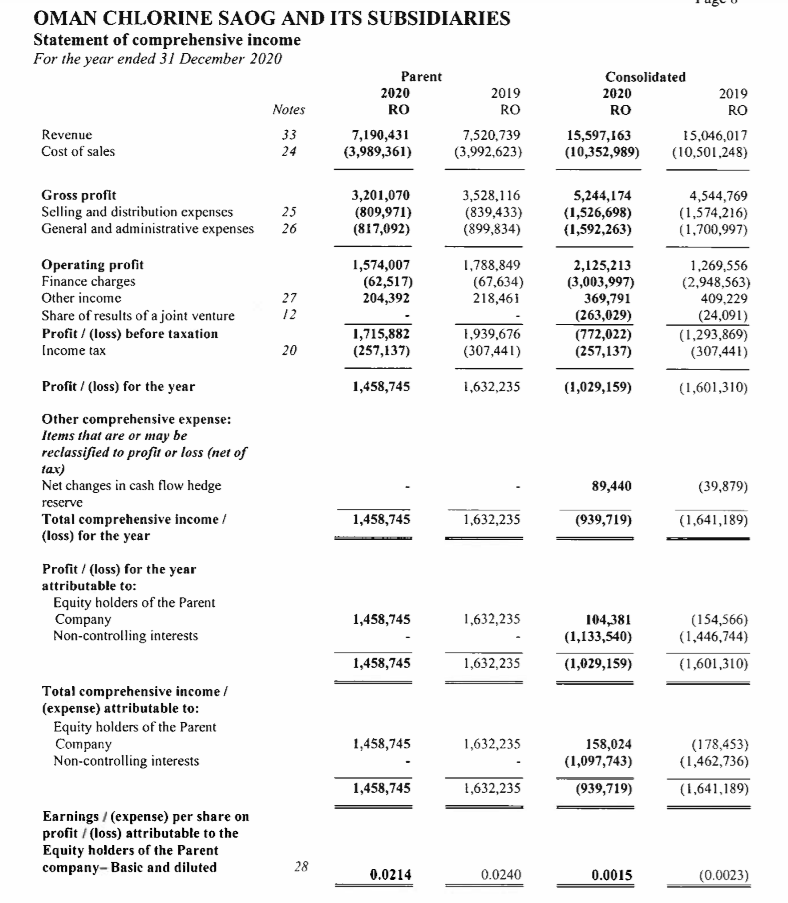
Consolidated 2020 RO 2019 RO 75,452,403 73,651 73,472,145 73,651 2,920,378 2,274,184 2,980,667 2,315,420 80,720,616 78,841,883 OMAN CHLORINE SAOG AND ITS SUBSIDIARIES Statement of financial position As ar 31 December 2020 Parent 2020 2019 Notes RO RO ASSETS Non-current assets Property, plant and equipment 12,207,975 8,444,554 Goodwill 9 Investment in subsidiaries 10 12,808,681 13.431,435 Sub-ordinated loan to subsidiary 29 767,592 Investment in joint venture Right of use assets 12 643,330 672,480 Total non-current assets 26,427,578 22,548,469 Current assets Inventories and consumables 13 909,674 1,003,239 Trade and other receivables 3,018,369 2,686,616 Cash and cash equivalent 15 2,553,443 4,377,253 Total current assets 6,481,486 8,067,108 Total assets 32,909,064 30,615,577 EQUITY AND LIABILITIES Equity Share capital 16 6,810,366 6,810,366 Statutory reserve 17 2,848,394 2,848,394 General reserve 18a 800,000 750,000 Cash flow bedge reserve 186 Retained earnings 16,740,452 16,012,743 Equity attributable to the Parent Company's shareholders 27,199,212 26,421,503 Non-controlling interest 2,515,377 5,513,952 3,657,254 2,644,081 4,486,803 6,087,058 13,217,942 92,059,825 11,686,583 92,407,199 6,810,366 2,848,423 800,000 (169,833) 12,096,441 6,810,366 2,848,423 750,000 (223,476) 12,723,096 22,385,397 22,908,409 10 6,429,694 7,527,369 27,199,212 26,421,503 28,815,091 30,435,778 Total equity Non-current Liabilities Bank borrowings End of service benefits Lease liabilities Cash now hedge Deferred tax liability 23 19 12 186 20 1,433,425 141,196 630,406 640,517 367,168 169,852 638,188 669,682 43,929,289 253,709 2,207,260 183,494 640,517 39,813,059 248,761 2,192,082 260,004 669,682 2,845,544 1,844,890 47,214,269 43,183,588 21 12 2,217,360 58,375 1,596,729 9,473 244,778 350,387 Total non-current liabilities Current liabulties Trade and other payables Lease liabilities Retentions due to contractors Bank borrowings Short term borrowings Cash flow hedge Income tax payable Total current liabilities Total Habilities Total equity and liabilities 23 23 186 20 6,392,849 99,551 1,493,894 5,820,947 2,126,653 100,150 343,795 16,377,839 4,948,738 48,335 1,493,894 8,365,452 3,078,369 113,076 392,595 18,440,459 392,595 343,795 2,864,308 5,709,852 2,349,184 4,194,074 63,592,108 61,624,047 32,909,064 30,615,577 92,407,199 92,059,825 Net asset per share 22 0.399 0.388 0.329 0.336 OMAN CHLORINE SAOG AND ITS SUBSIDIARIES Statement of comprehensive income For the year ended 31 December 2020 Parent 2020 2019 Notes RO RO Revenue 33 7,190,431 7,520,739 Cost of sales (3,989,361) (3,992,623) Consolidated 2020 2019 RO RO 15,597,163 15,046,017 (10,352,989) (10,501,248) 24 Gross profit Selling and distribution expenses General and administrative expenses 25 26 3,201,070 (809,971) (817,092) 3,528,116 (839,433) (899,834) 5,244,174 (1,526,698) (1,592,263) 4,544,769 (1,574,216) (1,700,997) Operating profit Finance charges Other income Share of results of a joint venture Profit (loss) before taxation Income tax 1,574,007 (62,517) 204,392 1,788,849 (67,634) 218,461 27 12 2,125,213 (3,003,997) 369,791 (263,029) (772,022) (257,137) 1,269,556 (2,948,563) 409,229 (24,091) (1,293,869) (307,441) 1,715,882 (257,137) 20 1,939,676 (307,441) 1,458,745 1,632,235 (1,029,159) (1,601,310) 89,440 (39,879) Profit / (loss) for the year Other comprehensive expense: Items that are or may be reclassified to profit or loss (net of tax) Net changes in cash flow hedge reserve Total comprehensive income / (loss) for the year Profit / (loss) for the year attributable to: Equity holders of the Parent Company Non-controlling interests 1,458,745 1,632,235 (939,719) (1,641,189) 1,458,745 1,632,235 104,381 (1,133,540) (1,029,159) (154,566) (1.446,744) (1,601,310) 1,458,745 1,632,235 Total comprehensive income (expense) attributable to: Equity holders of the Parent Company Non-controlling interests 1,458,745 1,632,235 158,024 (1,097,743) (939,719) (178,453) (1,462,736) (1,641,189) 1,458,745 1,632,235 Earnings / (expense) per share on profit / (loss) attributable to the Equity holders of the Parent company-Basic and diluted 28 0.0214 0.0240 0.0015 (0.0023) Consolidated 2020 RO 2019 RO 75,452,403 73,651 73,472,145 73,651 2,920,378 2,274,184 2,980,667 2,315,420 80,720,616 78,841,883 OMAN CHLORINE SAOG AND ITS SUBSIDIARIES Statement of financial position As ar 31 December 2020 Parent 2020 2019 Notes RO RO ASSETS Non-current assets Property, plant and equipment 12,207,975 8,444,554 Goodwill 9 Investment in subsidiaries 10 12,808,681 13.431,435 Sub-ordinated loan to subsidiary 29 767,592 Investment in joint venture Right of use assets 12 643,330 672,480 Total non-current assets 26,427,578 22,548,469 Current assets Inventories and consumables 13 909,674 1,003,239 Trade and other receivables 3,018,369 2,686,616 Cash and cash equivalent 15 2,553,443 4,377,253 Total current assets 6,481,486 8,067,108 Total assets 32,909,064 30,615,577 EQUITY AND LIABILITIES Equity Share capital 16 6,810,366 6,810,366 Statutory reserve 17 2,848,394 2,848,394 General reserve 18a 800,000 750,000 Cash flow bedge reserve 186 Retained earnings 16,740,452 16,012,743 Equity attributable to the Parent Company's shareholders 27,199,212 26,421,503 Non-controlling interest 2,515,377 5,513,952 3,657,254 2,644,081 4,486,803 6,087,058 13,217,942 92,059,825 11,686,583 92,407,199 6,810,366 2,848,423 800,000 (169,833) 12,096,441 6,810,366 2,848,423 750,000 (223,476) 12,723,096 22,385,397 22,908,409 10 6,429,694 7,527,369 27,199,212 26,421,503 28,815,091 30,435,778 Total equity Non-current Liabilities Bank borrowings End of service benefits Lease liabilities Cash now hedge Deferred tax liability 23 19 12 186 20 1,433,425 141,196 630,406 640,517 367,168 169,852 638,188 669,682 43,929,289 253,709 2,207,260 183,494 640,517 39,813,059 248,761 2,192,082 260,004 669,682 2,845,544 1,844,890 47,214,269 43,183,588 21 12 2,217,360 58,375 1,596,729 9,473 244,778 350,387 Total non-current liabilities Current liabulties Trade and other payables Lease liabilities Retentions due to contractors Bank borrowings Short term borrowings Cash flow hedge Income tax payable Total current liabilities Total Habilities Total equity and liabilities 23 23 186 20 6,392,849 99,551 1,493,894 5,820,947 2,126,653 100,150 343,795 16,377,839 4,948,738 48,335 1,493,894 8,365,452 3,078,369 113,076 392,595 18,440,459 392,595 343,795 2,864,308 5,709,852 2,349,184 4,194,074 63,592,108 61,624,047 32,909,064 30,615,577 92,407,199 92,059,825 Net asset per share 22 0.399 0.388 0.329 0.336 OMAN CHLORINE SAOG AND ITS SUBSIDIARIES Statement of comprehensive income For the year ended 31 December 2020 Parent 2020 2019 Notes RO RO Revenue 33 7,190,431 7,520,739 Cost of sales (3,989,361) (3,992,623) Consolidated 2020 2019 RO RO 15,597,163 15,046,017 (10,352,989) (10,501,248) 24 Gross profit Selling and distribution expenses General and administrative expenses 25 26 3,201,070 (809,971) (817,092) 3,528,116 (839,433) (899,834) 5,244,174 (1,526,698) (1,592,263) 4,544,769 (1,574,216) (1,700,997) Operating profit Finance charges Other income Share of results of a joint venture Profit (loss) before taxation Income tax 1,574,007 (62,517) 204,392 1,788,849 (67,634) 218,461 27 12 2,125,213 (3,003,997) 369,791 (263,029) (772,022) (257,137) 1,269,556 (2,948,563) 409,229 (24,091) (1,293,869) (307,441) 1,715,882 (257,137) 20 1,939,676 (307,441) 1,458,745 1,632,235 (1,029,159) (1,601,310) 89,440 (39,879) Profit / (loss) for the year Other comprehensive expense: Items that are or may be reclassified to profit or loss (net of tax) Net changes in cash flow hedge reserve Total comprehensive income / (loss) for the year Profit / (loss) for the year attributable to: Equity holders of the Parent Company Non-controlling interests 1,458,745 1,632,235 (939,719) (1,641,189) 1,458,745 1,632,235 104,381 (1,133,540) (1,029,159) (154,566) (1.446,744) (1,601,310) 1,458,745 1,632,235 Total comprehensive income (expense) attributable to: Equity holders of the Parent Company Non-controlling interests 1,458,745 1,632,235 158,024 (1,097,743) (939,719) (178,453) (1,462,736) (1,641,189) 1,458,745 1,632,235 Earnings / (expense) per share on profit / (loss) attributable to the Equity holders of the Parent company-Basic and diluted 28 0.0214 0.0240 0.0015 (0.0023)