

Question
Company A produces and sells a consumer product. To better understand its operations, the company collects data for analysis. The sales data are the total
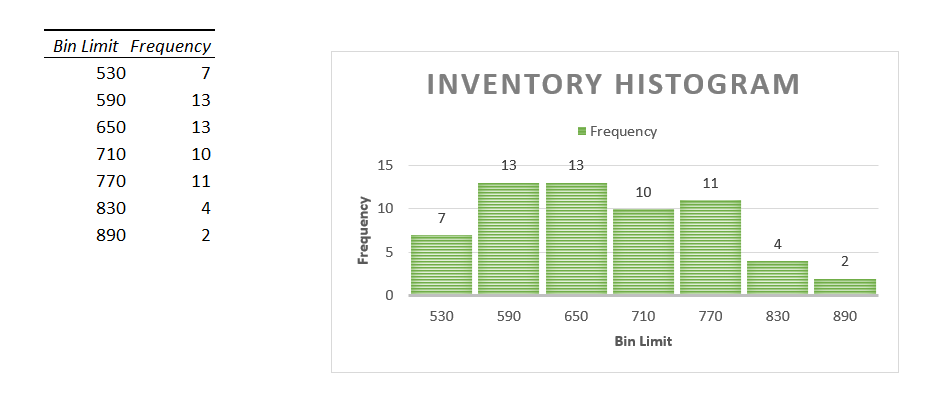
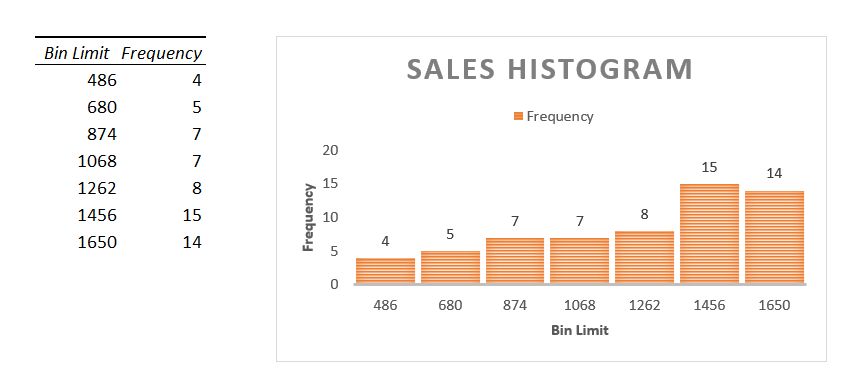
Company A produces and sells a consumer product. To better understand its operations, the company collects data for analysis. The sales data are the total selling price of finished goods transacted in a month, and the inventory data are the average on-hand inventory in a year.
Please assist to analyse the sales and inventory data below. Please provide observations and conclusions from the visualisation (Histogram) and a numerical description (Descriptive Statistics) of the two variables (Sales & Inventory) according to the following requirements:
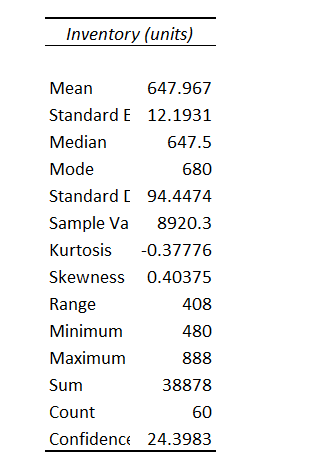
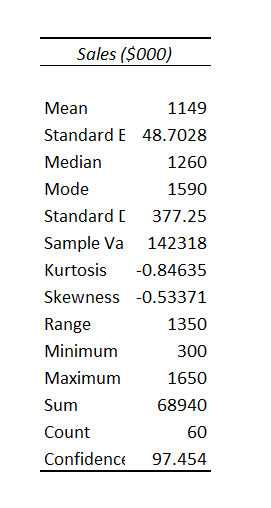
In terms of patterns, the distribution of the variables and descriptive statistical measures.
(e.g measures of location mean, median, mode measures of spread range, variance, standard deviation, measures of shape: skewness & kurtosis)
Sales Variable
Step by Step Solution
There are 3 Steps involved in it
Step: 1

Get Instant Access to Expert-Tailored Solutions
See step-by-step solutions with expert insights and AI powered tools for academic success
Step: 2

Step: 3
Ace Your Homework with AI
Get the answers you need in no time with our AI-driven, step-by-step assistance
Get Started
Finite Math And Applied Calculus
Authors: Stefan Waner, Steven Costenoble
6th Edition
1285415132, 9781285415130