Company: Coca Cola
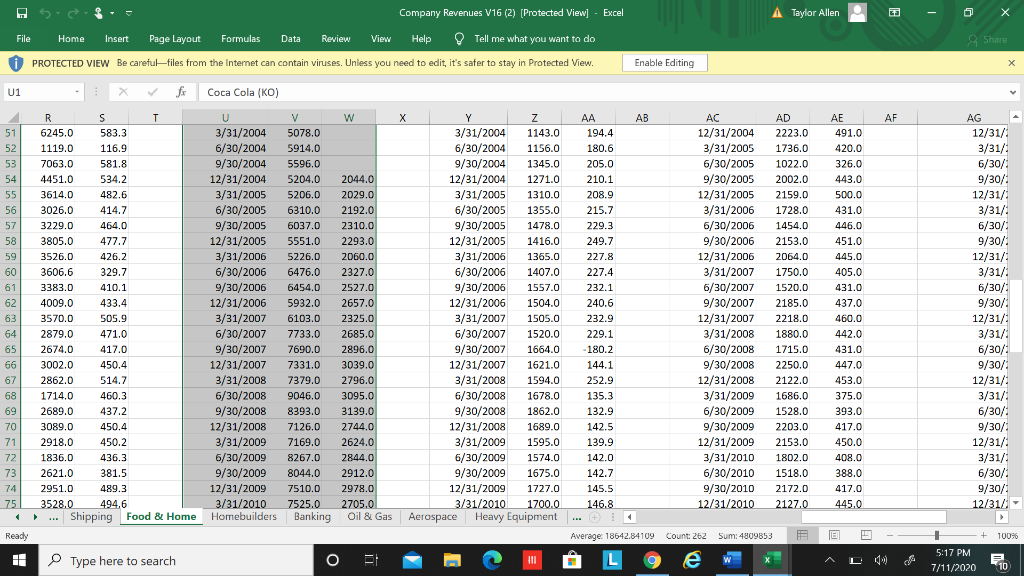
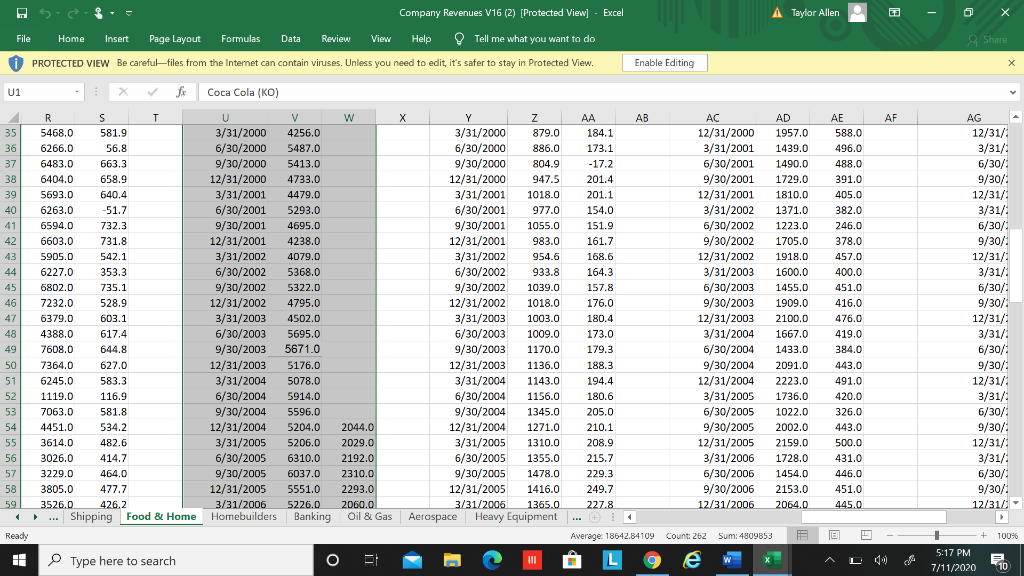
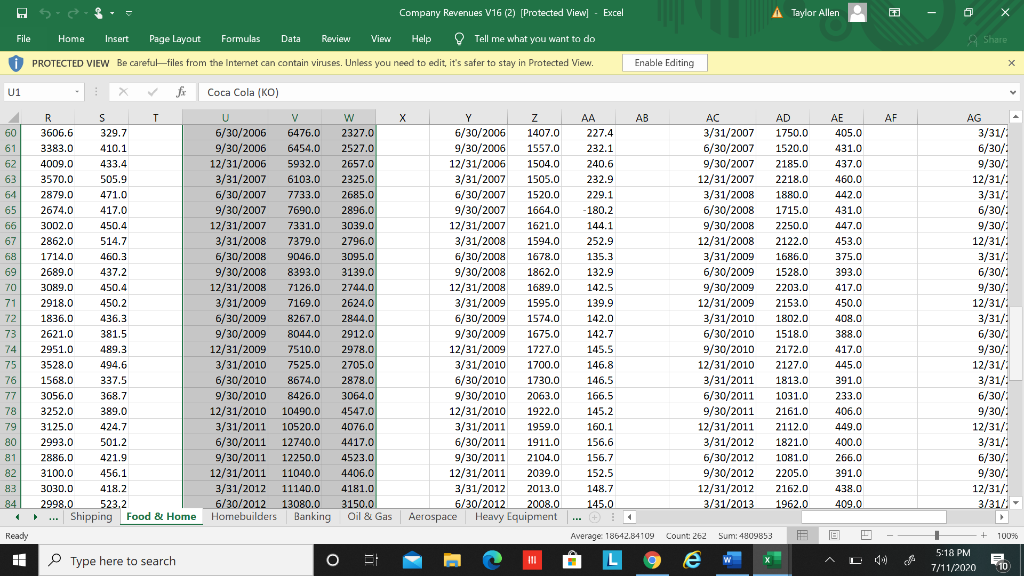
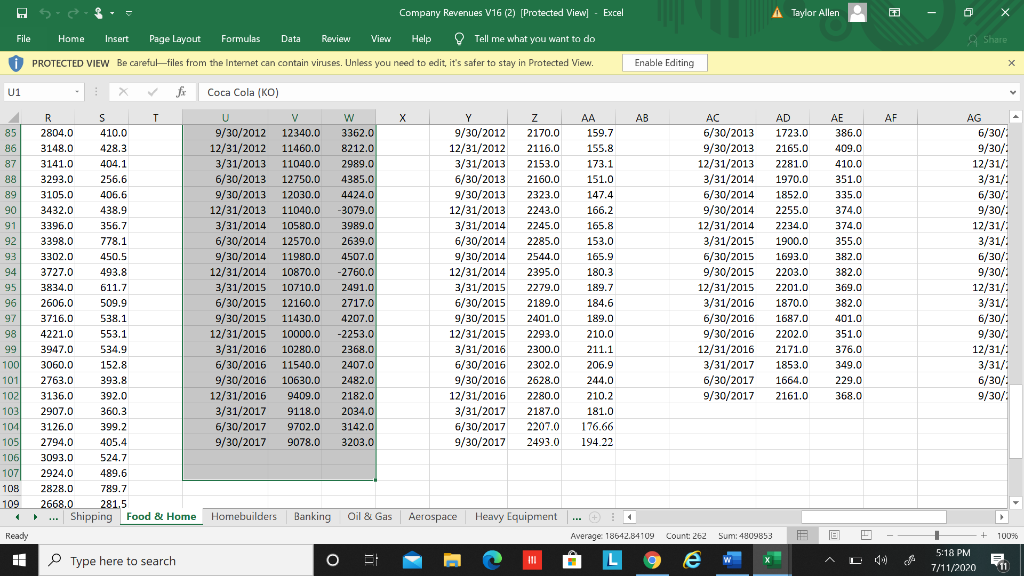
Company Revenues V16: 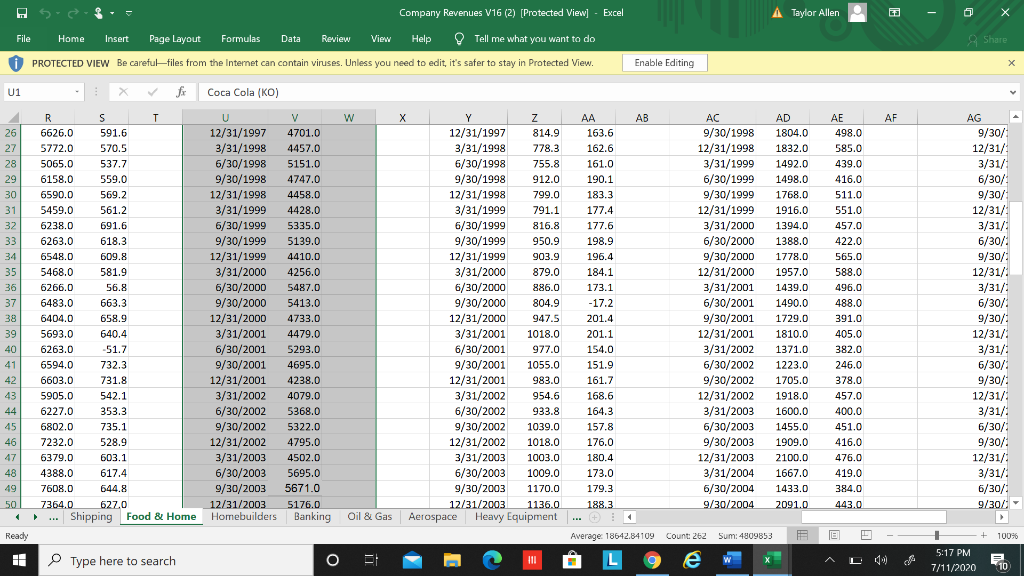
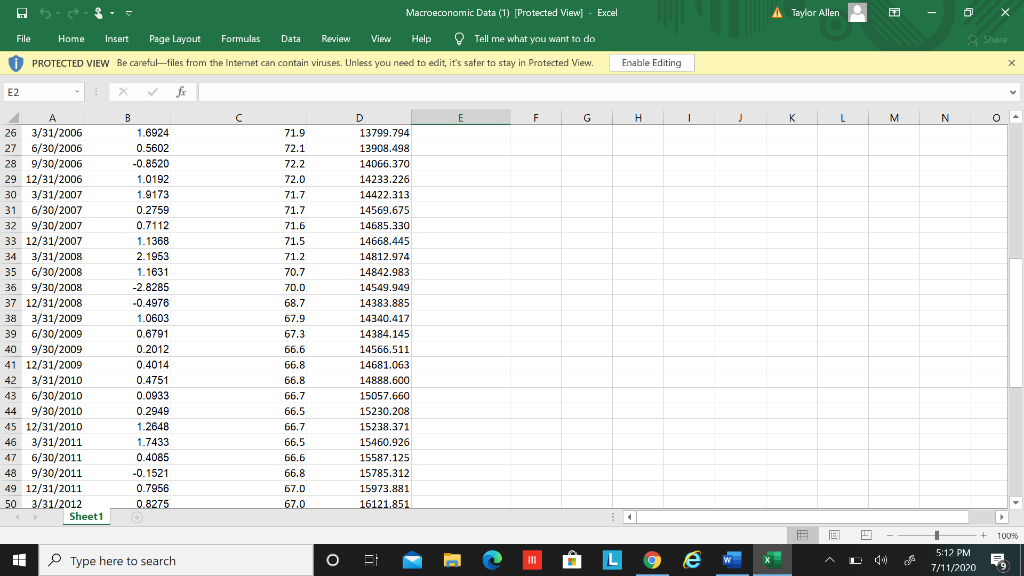
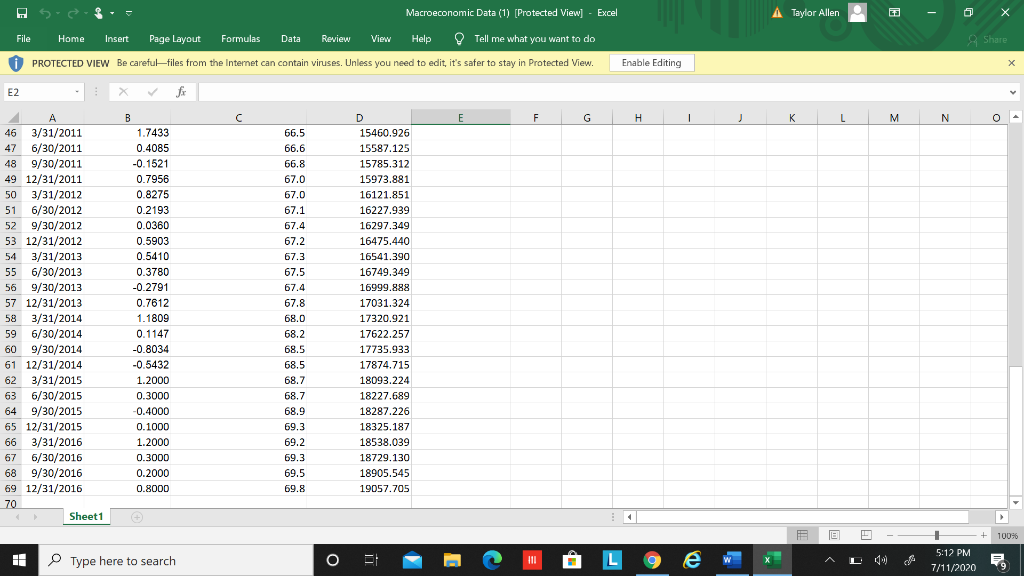
Macroeconomic Data: 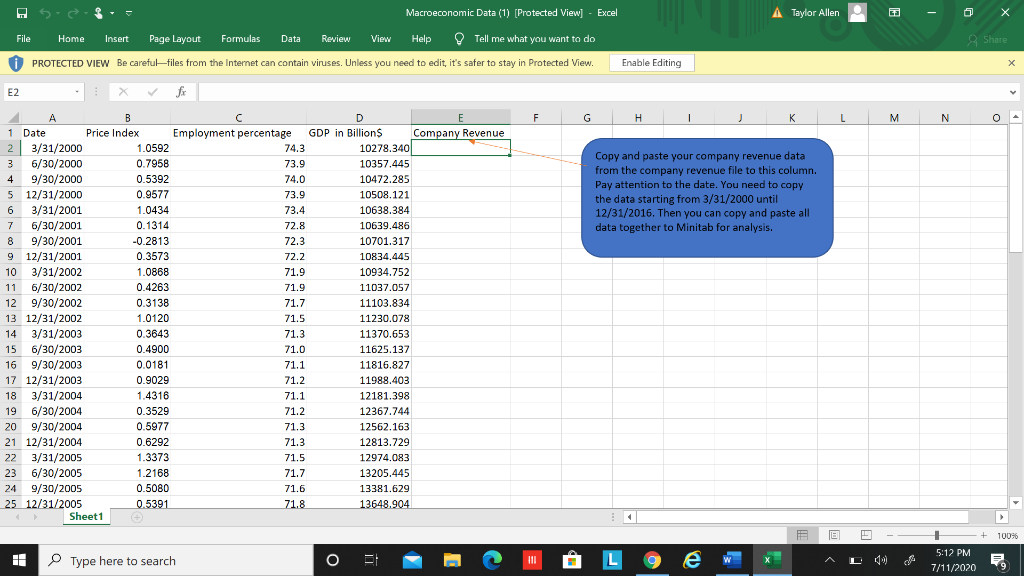
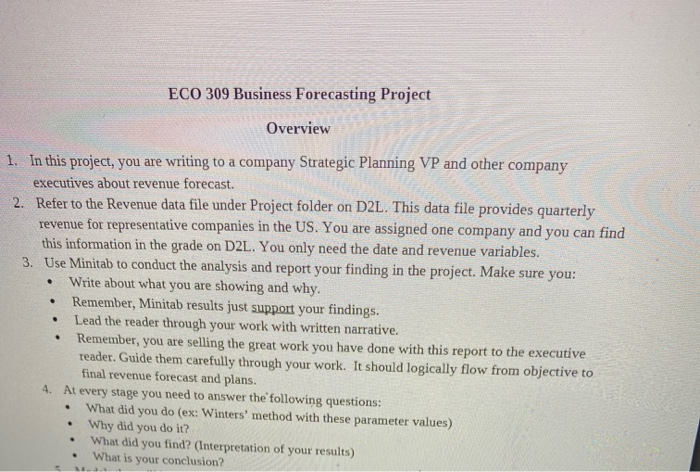
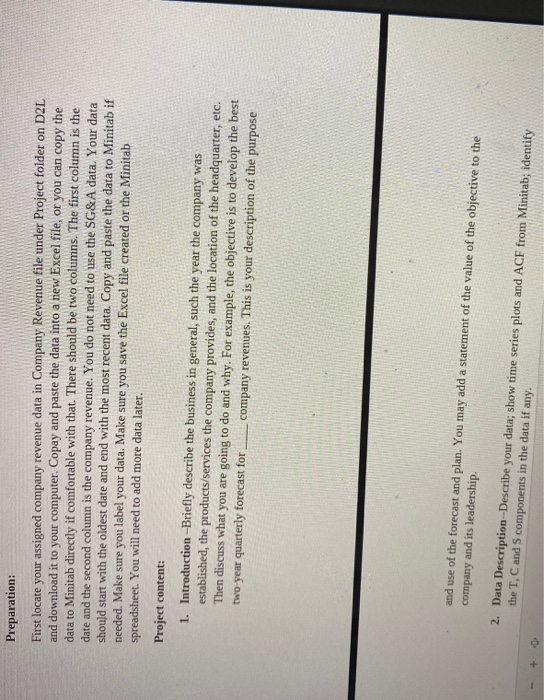
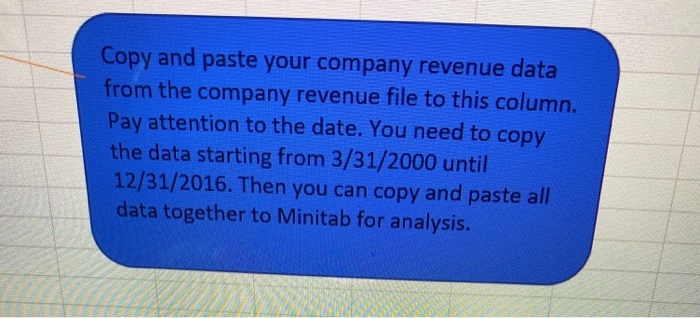
Ga Share AF 420 Company Revenues V16 (2) (Protected View] - Excel A Taylor Allen File Home Insert Page Layout Formulas Data Review View Help Tell me what you want to do PROTECTED VIEW Be carefulfiles from the Internet can contain viruses. Unless you need to edit, it's safer to stay in Protected View. Enable Editing U1 fr Coca Cola (KO) R S T U V w X Y Z AA AB AC AD AE 26 6626.0 591.6 12/31/1997 4701.0 12/31/1997 814.9 163.6 9/30/1998 1804.0 498.0 27 5772.0 570.5 3/31/1998 4457.0 3/31/1998 778.3 162.6 12/31/1998 1832.0 585.0 28 5065.0 537.7 6/30/1998 5151.0 6/30/1998 755.8 161.0 3/31/1999 1492.0 439.0 29 6158.0 559.0 9/30/1998 4747.0 9/30/1998 912.0 190.1 6/30/1999 1498.0 416.0 30 6590.0 569.2 12/31/1998 4458.0 12/31/1998 799.0 183.3 9/30/1999 1768.0 511.0 561 31 5459.0 561.2 3/31/1999 4428.0 3/31/1999 204 791.1 177.4 12191/1000 12/31/1999 1916.0 551.0 --- 32 6238.0 691.6 55016 6/30/1999 5335.0 6/30/1999 816.8 177.6 3/31/2000 1394.0 457.0 23 33 6263.0 618.3 9/30/1999 5139.0 9/30/1999 950.9 198.9 6/30/2000 1388.0 422.0 34 34 6548.0 609.8 12/31/1999 4410.0 12/31/1999 903.9 196.4 9/30/2000 1778.0 565.0 35 5468.0 581.9 3/31/2000 4256.0 3/31/2000 879.0 184.1 12/31/2000 1957.0 588.0 36 6266.0 b2bb. 56.8 6/30/2000 5487.0 6/30/2000 886.0 000.0 173.1 13. 1439.0 3/31/2001 1459.0 496.0 37 6483.0 VOS. 663.3 9/30/2000 5413.0 9/30/2000 804.9 -17.2 6/30/2001 27.2 1490.0 488.0 6404.0 *010 38 658.9 700.0 . 12/31/2000 4733.0 12/31/2000 947.5 201.4 9/30/2001 1729.0 want 391.0 . 39 5693.0 640.4 3/31/2001 4479.0 www 3/31/2001 1018.0 201.1 12/31/2001 100 1810.0 405.0 40 6263.0 -51.7 6/30/2001 5293.0 2225 6/30/2001 977.0 154.0 3/31/2002 1371.0 382.0 41 6594.0 732.3 9/30/2001 4695.0 9/30/2001 1055.0 151.9 6/30/2002 1223.0 246.0 - 42 6603.0 731.8 12/31/2001 4238.0 12/31/2001 983.0 161.7 9/30/2002 1705.0 378.0 43 5905.0 542.1 3/31/2002 4079.0 3/31/2002 954.6 ** 168.6 12/31/2002 1918.0 457.0 44 6227.0 353.3 *** 6/30/2002 5368.0 6/30/2002 933.8 164.3 3/31/2003 1600.0 con WA003 400.0 45 6802.0 4000 735.1 9/30/2002 5322.0 9/30/2002 1039.0 1520 ACE 157.8 6/30/2003 1455.0 451.0 7232 7232.0 46 528.9 4705 12/31/2002 4795.0 12/31/2002 1018.0 176.0 9/30/2003 1909.0 416.0 47 6379.0 603.1 3/31/2003 4502.0 3/31/2003 1003.0 180.4 12/31/2003 2100.0 476.0 48 4388.0 617.4 6/30/2003 5695.0 6/30/2003 1009.0 173.0 3/31/2004 1667.0 419.0 49 7608.0 644.8 9/30/2003 5671.0 9/30/2003 1170.0 179.3 6/30/2004 1433.0 384.0 50 7364.0 627.0 12/31/2003 5176.0 12/31/2003 1135.0 188.3 9/30/2004 2091.0 443.0 . Shipping Food & Home Homebuilders Oil & Gas Aerospace Heavy Equipment Ready Average 18642.84109 Count: 262 Sum: 4809853 E HE Type here to search O 111 AG 9/30/ 12/31/ 3/31/ 6/30/ 9/30/ 12/31/ 3/31/ 6/30/ 9/30/1 12/31/ 3/31/ 6/30/ 9/30/ 12/31/ 3/31/ 6/30/ 9/30/ 12/31/ 3/31/ 6/30/ 9/30/ 1 12/31/ 3/31/ 6/30/ 9/30/1 Banking 100% e 5:17 PM 7/11/2020 10 Ga Share AF 2278 155. Company Revenues V16 (2) (Protected View] - Excel A Taylor Allen File Home Insert Page Layout Formulas Data Review View Help Tell me what you want to do PROTECTED VIEW Be carefulfiles from the Internet can contain viruses. Unless you need to edit, it's safer to stay in Protected View. Enable Editing U1 fr Coca Cola (KO) R S T U V w X Y Z AA AB AC AD AE 51 6245.0 583.3 3/31/2004 5078,0 3/31/2004 1143.0 194.4 12/31/2004 2223.0 491.0 52 1119,0 116.9 6/30/2004 5914.0 6/30/2004 1156.0 180.6 3/31/2005 1736.0 420.0 53 7063.0 581.8 9/30/2004 5596.0 9/30/2004 1345.0 205.0 6/30/2005 1022.0 326.0 54 4451.0 534.2 12/31/2004 5204.0 2044.0 12/31/2004 1271.0 210.1 9/30/2005 2002.0 443.0 55 3614.0 482.6 3/31/2005 5206.0 2029.0 3/31/2005 1310.0 208.9 12/31/2005 2159.0 500.0 ES 56 3026.0 414.7 4147 6/30/2005 6310.0 2192.0 6/30/2005 1355.0 215.7 3/31/2006 15006 1728.0 1720 431.0 57 3229.0 464.0 9/30/2005 6037.0 2310.0 9/30/2005 1478.0 229.3 6/30/2006 1454.0 446.0 58 58 3805.0 477.7 12/31/2005 5551.0 2293.0 12/31/2005 1416.0 249.7 9/30/2006 2153.0 451.0 59 3526.0 426.2 3/31/2006 5226.0 2060.0 3/31/2006 1365.0 12/31/2006 2064.0 445.0 445.0 60 3606.6 329.7 6/30/2006 6476.0 2327.0 6/30/2006 1407.0 227.4 227.4 3/31/2007 1750.0 405.0 61 3383.0 SOU 410.1 9/30/2006 6454.0 2527.0 9/30/2006 232.1 232.1 6/30/2007 1520.0 431.0 131.0 62 4009.0 433,4 *009.0 12/31/2006 2017 5932.0 5932.0 2657.0 12/31/2006 12/31/2000 1504.0 240.6 9/30/2007 240.0 2185.0 437.0 63 3570,0 505.9 *. www. 3/31/2007 6103.0 2325.0 3/31/2007 1505.0 232.9 100 21 103.4 12/31/2007 2. 2218.0 460.0 64 2879.0 471.0 6/30/2007 7733.0 2685.0 6/30/2007 1520.0 229.1 an 2002 10 3/31/2008 1880.0 442.0 65 2674.0 417.0 - 9/30/2007 7690.0 100 2896.0 9/30/2007 100 1664.0 - 180.2 6/30/2008 1715.0 2000 431.0 66 00 3002.0 450,4 12/31/2007 7331.0 3039.0 12/31/2007 1621.0 144.1 9/30/2008 100 2250.0 447.0 67 2862.0 514.7 3/31/2008 7379.0 2796.0 3/31/2008 1594.0 252.9 sem 12/31/2008 co 453.0 2122.0 000 68 1714.0 460.3 6/30/2008 9046.0 3095.0 6/30/2008 1678.0 135.3 3/31/2009 1686.0 375.0 69 2689.0 437.2 9/30/2008 100 8393.0 3139.0 9/30/2008 1862.0 132.9 2000 6/30/2009 1528.0 393.0 70 3089.0 450.4 12/31/2008 44 7126.0 2744.0 12/31/2008 1689.0 2009 142.5 9/30/2009 24 2203.0 417.0 2010 AER 71 2918.0 450.2 san 3/31/2009 7169.0 2624.0 1 3/31/2009 1595.0 139.9 12/31/2009 2153.0 72 72 1836.0 436.3 6/30/2009 8267.0 2844.0 6/30/2009 142.0 3/31/2010 1802.0 408.0 73 2621.0 381.5 9/30/2009 8044.0 2912.0 9/30/2009 1675.0 142.7 6/30/2010 1518.0 388.0 74 2951.0 489.3 12/31/2009 7510.0 2978.0 12/31/2009 1727.0 145.5 9/30/2010 2172.0 417.0 75 3528.0 494,6 3/31/2010 7525.0 2705.0 3/31/2010 1700.0 146.8 12/31/2010 2127.0 445.0 ... Shipping Food & Home Homebuilders Banking Oil & Gas Aerospace Heavy Equipment Ready Average 18642.84109 Count: 262 Sum: 4809853 E HE Type here to search O 111 AG 12/31/ 3/31/ 6/30/ 9/30/ 12/31/ 3/31/ 6/30/ 9/30/ 12/31/1 3/31/ 6/30/ 9/30/ 12/31/ 3/31/ 6/30/ 9/30/ 12/31/ 3/31/ 6/30/ 9/30/ 12/31/ 3/31/ 6/30/ 9/30/3 12/31/ 450.0 1574.0 100% e 5:17 PM 7/11/2020 10 Ga Share AF 5905.0 151.0 Company Revenues V16 (2) (Protected View] - Excel A Taylor Allen File Home Insert Page Layout Formulas Data Review View Help Tell me what you want to do PROTECTED VIEW Be carefulfiles from the Internet can contain viruses. Unless you need to edit, it's safer to stay in Protected View. Enable Editing U1 fr Coca Cola (KO) R S T U V w X Y Z AA AB AC AD AE 35 5468.0 581.9 3/31/2000 4256.0 3/31/2000 879.0 184.1 12/31/2000 1957.0 588.0 36 6266.0 56.8 6/30/2000 5487.0 6/30/2000 886.0 173.1 3/31/2001 1439.0 496.0 37 6483,0 663.3 9/30/2000 5413.0 9/30/2000 804.9 -17.2 6/30/2001 1490.0 488.0 38 6404.0 658.9 12/31/2000 4733.0 12/31/2000 947.5 201.4 9/30/2001 1729.0 391.0 39 5693.0 640.4 3/31/2001 4479.0 3/31/2001 1018.0 201.1 12/31/2001 1810.0 405.0 40 6263.0 -51.7 6/30/2001 5293.0 6/30/2001 977.0 154.0 3/31/2002 1371.0 382.0 41 6594.0 732.3 7323 9/30/2001 4695.0 9/30/2001 1055.0 151.9 6/30/2002 1223.0 246.0 42 42 6603.0 731.8 7218 12/31/2001 4238.0 12/31/2001 983.0 161.7 9/30/2002 1705.0 378.0 43 542.1 3/31/2002 4079.0 3/31/2002 954.6 168.6 12/31/2002 1918.0 457.0 44 6227.0 353.3 6/30/2002 5368.0 6/30/2002 933.8 164.3 3/31/2003 1600.0 400.0 45 6802.0 735.1 9/30/2002 5322.0 9/30/2002 1039.0 6/30/2003 1455.0 1435.0 451.0 31.0 46 7232.0 120.9 528.9 12/31/2002 12/31/10 4795.0 12/31/2002 1018.0 176.0 9/30/2003 1018.0 110. 1909.0 416.0 *10.4 47 6379.0 603.1 1. 3/31/2003 4502.0 3/31/2003 1003.0 US 180.4 12/31/2003 2100.0 476.0 11...... 48 4388.0 617.4 6/30/2003 5695.0 6/30/2003 1009.0 173.0 3/31/2004 1667.0 419.0 se 49 7608.0 644.8 *** . 9/30/2003 5671.0 9/30/2003 1170.0 179.3 6/30/2004 440 1433.0 384.0 50 7364.0 627.0 12/31/2003 5176.0 2002 3170 12/31/2003 1136.0 188.3 9/30/2004 443.0 110 2091.0 2009 51 6245.0 583.3 wetu 3/31/2004 5078.0 3/31/2004 1143.0 194.4 12/31/2004 To 12 2223.0 491.0 *** 52 - 1119.0 116.9 6/30/2004 5914.0 6/30/2004 1156.0 180.6 3/31/2005 1736.0 s. 420.0 1 53 7063.0 581.8 9/30/2004 5596.0 9/30/2004 1345.0 205.0 6/30/2005 wer 1022.0 326.0 2018 *** 534.2 w 54 4451.0 12/31/2004 5204.0 2044.0 12/31/2004 1271.0 210.1 9/30/2005 10 2002.0 443.0 206 Waldo 482.6 55 3614.0 47400 3/31/2005 5206.0 2029.0 3/31/2005 2000 7100 1310.0 208.9 12/31/2005 2159.0 500.0 56 3026.0 414.7 6/30/2005 2192.0 6/30/2005 1355.0 215.7 3/31/2006 1728.0 431.0 57 3229.0 464.0 9/30/2005 6037.0 2310.0 9/30/2005 1478.0 229.3 6/30/2006 1454.0 446.0 58 3805.0 477.7 12/31/2005 5551.0 2293.0 12/31/2005 1416.0 249.7 9/30/2006 2153.0 451,0 59 3526.0 426,2 3/31/2006 5226.0 2060.0 3/31/2006 1365.0 227.8 12/31/2006 2064.0 445.0 ... Shipping Food & Home Homebuilders Banking Oil & Gas Aerospace Heavy Equipment Ready Average 18642.84109 Count: 262 Sum: 4809853 E HE Type here to search O 111 AG 12/31/ 3/31/ 6/30/ 9/30/ 12/31/ 21217 3/31/ 6/30/ 9/30/ 12/31/ 3/31/ 6/30/ 9/30/ 12/31/ 3/31/ 6/30/ 9/30/ 12/31/ 3/31/1 6/30/ 9/30/ -- 12/31/ 3/31/ 6/30/ 9/30/: 12/31/ 6310.0 100% 5:17 PM 7/11/2020 10 Ga Share AF 2896.0 3/31/2009 s12012011 100.0 AA17.0 Company Revenues V16 (2) (Protected View] - Excel A Taylor Allen File Home Insert Page Layout Formulas Data Review View Help Tell me what you want to do PROTECTED VIEW Be carefulfiles from the Internet can contain viruses. Unless you need to edit, it's safer to stay in Protected View. Enable Editing U1 fr Coca Cola (KO) R S T U V w X Y Z AA AB AC AD AE 60 3606.6 329.7 6/30/2006 6476.0 2327.0 6/30/2006 1407.0 227.4 3/31/2007 1750.0 405.0 61 3383.0 410.1 9/30/2006 6454.0 2527.0 9/30/2006 1557.0 232.1 6/30/2007 1520.0 431.0 62 4009.0 433.4 12/31/2006 5932.0 2657.0 12/31/2006 1504.0 240.6 9/30/2007 2185.0 437.0 63 3570.0 505.9 3/31/2007 6103.0 2325.0 3/31/2007 1505.0 232.9 12/31/2007 2218.0 460.0 64 2879.0 471.0 6/30/2007 7733.0 2685.0 6/30/2007 1520.0 24 229.1 3/31/2008 1880.0 442.0 492 65 2674.0 417.0 9/30/2007 7690.0 9/30/2007 1664.0 -180.2 6/30/2008 1715.0 431.0 GE 66 3002.0 450.4 12/31/2007 7331.0 3039.0 12/31/2007 1621.0 144.1 9/30/2008 2250.0 447.0 67 2862.0 514.7 3/31/2008 7379.0 2796.0 3/31/2008 1594.0 252.9 12/31/2008 2122.0 453.0 68 68 1714.0 460.3 6/30/2008 9046.0 3095.0 6/30/2008 1678.0 135.3 3/31/2009 1686.0 375.0 69 69 2689.0 437.2 9/30/2008 8393.0 3139.0 9/30/2008 1862.0 132.9 6/30/2009 1528.0 393.0 70 3089.0 450.4 434.9 12/31/2008 7126.0 2744.0 2744.0 12/31/2008 1689.0 142.5 142,5 9/30/2009 su/2009 2203.0 417.0 71 2918.0 450.2 10:4 3/31/2009 7169.0 2624.0 1595.0 1930 200 12/31/2009 139.9 2153.0 450.0 APRIL 72 1836.0 436.3 w 6/30/2009 8267.0 2844.0 6/30/2009 1574.0 142.0 3/31/2010 1802.0 408.0 Www 73 2621.0 381.5 9/30/2009 8044.0 2912.0 9/30/2009 142.7 1675.0 1518.0 WOW 6/30/2010 388,0 12 - . 74 2951.0 489.3 12/31/2009 7510.0 2978.0 12/31/2009 1727.0 no 145.5 9/30/2010 2172.0 417.0 75 3528.0 494.6 3/31/2010 7525.0 2018 2705.0 3/31/2010 1700.0 146.8 12/31/2010 2127.0 Town 445.0 ser 76 1568.0 337.5 6/30/2010 8674.0 2878.0 6/30/2010 1730.0 146.5 3/31/2011 1813.0 los 391.0 77 3056.0 368.7 9/30/2010 10 8426.0 3064.0 9/30/2010 2063.0 166.5 6/30/2011 1031.0 233.0 78 3252.0 389.0 12/31/2010 10490.0 4547.0 12/31/2010 1922.0 145.2 9/30/2011 2161.0 406.0 79 Www 3125.0 424.7 3/31/2011 10520.0 100 3/31/2011 1942 4076.0 1959.0 160.1 12/31/2011 2112.0 449.0 2009 80 2993.0 501.2 12740.0 6/30/2011 c11004 1911.0 156.6 3/31/2012 1821.0 09 81 2886.0 421.9 9/30/2011 12250.0 4523.0 9/30/2011 2104.0 156.7 6/30/2012 1081.0 266.0 82 3100.0 456.1 12/31/2011 11040.0 4406.0 12/31/2011 2039.0 152.5 9/30/2012 2205.0 391.0 83 3030.0 418.2 3/31/2012 11140.0 4181.0 3/31/2012 2013.0 148.7 12/31/2012 2162.0 438.0 2998.0 523,2 6/30/2012 13080.0 3150.0 6/30/2012 2008.0 145.0 3/31/2013 1962.0 409.0 ... Shipping Food & Home Homebuilders Banking Oil & Gas Aerospace Heavy Equipment Ready Average 18642.84109 Count: 262 Sum: 4809853 E HE Type here to search O 111 AG 3/31/ 6/30/ 9/30/ 12/31/ 3/31/ 6/30/ 9/30/ 12/31/ 3/31/ 6/30/ 9/30/ 12/31/ 3/31/ 6/30/ 9/30/ 12/31/ 3/31/ 6/30/ 9/30/ 12/31/ 3/31/ 6/30/ 9/30/ 12/31/ 3/31/ 84 100% e 5:18 PM 7/11/2020 10 A Taylor Allen Ga Company Revenues V16 (2) (Protected View] - Excel File Home Insert Page Layout Formulas Data Review View Help Tell me what you want to do i PROTECTED VIEW Be carefulfiles from the Internet can contain viruses. Unless you need to edit, it's safer to stay in Protected View. Share Enable Editing U1 fr Coca Cola (KO) X AB AF AG 6/30/ 9/30/ 12/31/ 3/31/ 6/30/ 9/30/ 85 86 87 88 89 90 91 92 92 93 94 95 96 97 98 99 100 101 102 103 ol soc 105 106 107 108 109 R S T U v 2804.0 410,0 9/30/2012 12340.0 3148.0 428.3 12/31/2012 11460,0 3141.0 404.1 3/31/2013 11040.0 3293.0 256.6 6/30/2013 12750.0 3105.0 406.6 9/30/2013 12030.0 3432.0 438.9 12/31/2013 11040.0 3567 3396.0 356.7 3/31/2014 10580.0 3398.0 778.1 6/30/2014 12570.0 3302.0 450.5 9/30/2014 11980.0 3727.0 493.8 12/31/2014 10870.0 3834.0 3834.0 611.7 3/31/2015 10710.0 2606.0 509.9 6/30/2015 12160.0 2001 3716.0 538.1 9/30/2015 11430.0 4221.0 553.1 12/31/2015 10000.0 *** 3947.0 534,9 3/31/2016 10280.0 3060.0 152.8 6/30/2016 11540.0 2763.0 393.8 9/30/2016 10630.0 w 3136.0 392.0 12/31/2016 9409.0 2907.0 360.3 3/31/2017 04100 9118.0 200 3126.0 399.2 6/30/2017 9702.0 2704 2794.0 405.4 9/30/2017 9078.0 3093.0 524.7 2924.0 489.6 2828.0 789.7 2668.0 281,5 ... Shipping Food & Home Homebuilders Banking w 3362.0 8212.0 2989.0 4385.0 4424.0 -3079.0 2070 3989.0 2639.0 4507.0 -2760.0 2491.0 2717.0 4207.0 -2253.0 2368.0 2407.0 2482.0 2182.0 2034.0 Y 9/30/2012 12/31/2012 3/31/2013 6/30/2013 9/30/2013 12/31/2013 3/31/2014 6/30/2014 9/30/2014 12/31/2014 3/31/2015 6/30/2015 9/30/2015 WW2 12/31/2015 3/31/2016 co 6/30/2016 9/30/2016 sland 12/31/2016 Z 2170.0 2116,0 2153.0 2160.0 2323.0 2243.0 2245.0 2285.0 2544.0 2395.0 2279.0 2189.0 2401.0 2293.0 *** 2300.0 2302.0 . 2628.0 2280.0 2187.0 2207.0 2493.0 AA 159.7 155.8 173.1 151.0 147.4 166.2 165.8 153.0 165.9 180.3 102.7 189.7 184.6 104.0 189.0 210.0 211.1 206.9 244.0 210.2 1040 181.0 176.66 194.22 AC 6/30/2013 9/30/2013 12/31/2013 3/31/2014 6/30/2014 9/30/2014 12/31/2014 3/31/2015 6/30/2015 9/30/2015 12/31/2015 3/31/2016 6/30/2016 9/30/2016 12/31/2016 3/31/2017 6/30/2017 9/30/2017 AD 1723.0 2165.0 2281.0 1970.0 1852.0 2255.0 2234.0 1900.0 1693.0 2203.0 2201.0 . 1870.0 soru 1687.0 2202.0 2171.0 1853.0 1664.0 2161.0 AE 386.0 409.0 410.0 351.0 335.0 374.0 374.0 355.0 382.0 382.0 369.0 302.0 382.0 401.0 351.0 376.0 349.0 229.0 368.0 12/31/ 3/31/. 6/30/ 9/30/ 14131 12/31/ 3/31/ 6/30/ 9/30/ 12/31/1 3/31/ 6/30/ 9/30/ 3/31/2017 104 3142.0 6/30/2017 9/30/2017 3203.0 Oil & Gas Aerospace Heavy Equipment Ready Average: 18642.84109 Count: 262 Sum: 4809853 e 100% HE Type here to search O 111 5:18 PM 7/11/2020 11 Macroeconomic Data (1) (Protected View] - Excel A Taylor Allen Ga Share File Home Insert Page Layout Formulas Data Review View Help Tell me what you want to do PROTECTED VIEW Be carefulfiles from the Internet can contain viruses. Unless you need to edit, it's safer to stay in Protected View. Enable Editing E2 fr v B F H 1 K M N 0 1 Copy and paste your company revenue data from the company revenue file to this column. Pay attention to the date. You need to copy the data starting from 3/31/2000 until 12/31/2016. Then you can copy and paste all data together to Minitab for analysis. 10834.445 A D E Date Price Index Employment percentage GDP in Billions Company Revenue 2 3/31/2000 1.0592 74.3 10278.340 3 6/30/2000 0.7958 73.9 10357.445 4 9/30/2000 0.5392 74.0 10472.285 5 12/31/2000 0.9577 73.9 10508.121 6 3/31/2001 1.0434 73.4 10638.384 7 6/30/2001 0.1314 72.8 10639.486 8 9/30/2001 -0.2813 72.3 10701.317 9 12/31/2001 0.3573 72.2 10 3/31/2002 1.0868 71.9 10934.752 11 6/30/2002 0.4263 71.9 11037.057 12 9/30/2002 12 2002 V.13 0.3138 71.7 11103.834 13 12/31/2002 1.0120 71.5 11230.078 www.ro 14 3/31/2003 2003 0.3643 71.3 11370.653 vie 15 6/30/2003 0.4900 71.0 11625.137 4401 16 9/30/2003 0.0181 71.1 11816.827 . 17 12/31/2003 0.9029 71.2 11988.403 18 3/31/2004 1.4316 71.1 12181.398 . lo 19 6/30/2004 0.3529 71.2 12367.744 . 20 9/30/2004 0.5977 71.3 12562.163 21 12/31/2004 4 1191/2004 7 0.6292 6202 71.3 12813.729 22 3/31/2005 1.3373 71.5 12974.083 23 6/30/2005 1.2168 71.7 13205.445 24 9/30/2005 0.5080 71.6 13381.629 25 12/31/2005 0.5391 71.8 13648.904 Sheet1 100% I Type here to search O 111 5:12 PM 7/11/2020 A Taylor Allen Ga Share v B - L M N 0 71.9 41011 5A60.926 Macroeconomic Data (1) (Protected View] - Excel File Home Insert Page Layout Formulas Data Review View Help Tell me what you want to do PROTECTED VIEW Be carefulfiles from the Internet can contain viruses. Unless you need to edit, it's safer to stay in Protected View. Enable Editing E2 fr A C D E F H 26 3/31/2006 1.6924 13799.794 27 6/30/2006 0.5602 72.1 13908.498 28 9/30/2006 -0.8520 72.2 14066.370 29 12/31/2006 1.0192 72.0 14233.226 30 3/31/2007 1.9173 71.7 14422.313 742 31 6/30/2007 0.2759 71.7 14569.675 22 71 32 9/30/2007 0.7112 71.6 14685.330 33 12/31/2007 1.1368 71.5 14668.445 24 34 3/31/2008 2. 1953 71.2 14812.974 35 6/30/2008 1.1631 70.7 10.7 14842.983 36 9/30/2008 -2.8285 70.0 . 14549.949 37 12/31/2008 -0.4976 68.7 22 Voir 14383.885 38 3/31/2009 1.0603 67.9 14340.417 39 6/30/2009 0.6791 67.3 14384.145 40 9/30/2009 0.2012 66.6 14566.511 1. 41 12/31/2009 0.4014 66.8 14681.063 an 42 3/31/2010 0.4751 66.8 14888.600 43 6/30/2010 0.0933 66.7 15057.660 2010 44 9/30/2010 *** 0.2949 66.5 15230.208 45 12/31/2010 42810 1.2648 66.7 15238.371 46 1.7433 66.5 47 6/30/2011 0.4085 66.6 15587.125 48 9/30/2011 -0.1521 66.8 15785.312 49 12/31/2011 0.7956 67.0 15973.881 50 3/31/2012 0.8275 67.0 16121.851 Sheet1 100% I Type here to search O 111 5:12 PM 7/11/2020 A Taylor Allen Ga Macroeconomic Data (1) (Protected View] - Excel Tell me what you want to do File Home Insert Page Layout Formulas Data Review View Help Share PROTECTED VIEW Be carefulfiles from the Internet can contain viruses. Unless you need to edit, it's safer to stay in Protected View. Enable Editing E2 fr v C E F H - L M N 0 A 46 3/31/2011 47 6/30/2011 48 9/30/2011 49 12/31/2011 50 3/31/2012 51 6/30/2012 52 9/30/2012 53 12/31/2012 54 54 3/31/2013 55 6/30/2013 56 9/30/2013 57 12/31/2013 58 3/31/2014 2011 59 6/30/2014 2017 60 9/30/2014 61 12/31/2014 62 3/31/2015 63 6/30/2015 A 64 9/30/2015 65 12/31/2015 66 3/31/2016 67 6/30/2016 68 9/30/2016 69 12/31/2016 70 Sheet1 B 1.7433 0.4085 -0.1521 0.7956 0.8275 0.2193 0.0360 0.5903 0.5410 0.3780 -0.2791 0.7612 W.1012 1.1809 0.1147 -0.8034 -0.5432 1.2000 0.3000 -0.4000 4000 0.1000 1.2000 0.3000 0.2000 0.8000 66.5 66.6 66.8 67.0 67.0 C 67.1 67A 67.4 67.2 672 67.3 67.5 67.4 07. 67.8 07.0 68,0 68.2 68.5 68.5 68.7 68.7 68.9 69.3 69.2 69.3 69.5 69.8 D 15460.926 15587.125 15785.312 15973.881 16121.851 16227.939 16297.349 16475.440 16541.390 16749.349 16999.888 17031.324 031.324 17320.921 17622.257 eerde 17735.933 17874.715 400 18093.224 18227.689 1024 18287.226 497 18325.187 18538.039 18729.130 18905.545 19057.705 100% I Type here to search O 111 5:12 PM 7/11/2020 ECO 309 Business Forecasting Project Overview 1. In this project, you are writing to a company Strategic Planning VP and other company executives about revenue forecast. 2. Refer to the Revenue data file under Project folder on D2L. This data file provides quarterly revenue for representative companies in the US. You are assigned one company and you can find this information in the grade on D2L. You only need the date and revenue variables. 3. Use Minitab to conduct the analysis and report your finding in the project. Make sure you: Write about what you are showing and why. Remember, Minitab results just support your findings. Lead the reader through your work with written narrative. Remember, you are selling the great work you have done with this report to the executive reader. Guide them carefully through your work. It should logically flow from objective to final revenue forecast and plans. 4. At every stage you need to answer the following questions: What did you do (ex: Winters' method with these parameter values) Why did you do it? What did you find? (Interpretation of your results) What is your conclusion? . . Preparation: First locate your assigned company revenue data in Company Revenue file under Project folder on D2L and download it to your computer. Copay and paste the data into a new Excel file, or you can copy the data to Minitab directly if comfortable with that. There should be two columns. The first column is the date and the second column is the company revenue. You do not need to use the SG&A data. Your data should start with the oldest date and end with the most recent data. Copy and paste the data to Minitab if needed. Make sure you label your data. Make sure you save the Excel file created or the Minitab spreadsheet. You will need to add more data later. Project content: 1. Introduction-Briefly describe the business in general, such the year the company was established, the products/services the company provides, and the location of the headquarter, etc. Then discuss what you are going to do and why. For example, the objective is to develop the best two-year quarterly forecast for company revenues. This is your description of the purpose and use of the forecast and plan. You may add a statement of the value of the objective to the company and its leadership. 2. Data Description--Describe your data; show time series plots and ACF from Minitab; identify the T, C and S components in the data if any. Copy and paste your company revenue data from the company revenue file to this column. Pay attention to the date. You need to copy the data starting from 3/31/2000 until 12/31/2016. Then you can copy and paste all data together to Minitab for analysis. Ga Share AF 420 Company Revenues V16 (2) (Protected View] - Excel A Taylor Allen File Home Insert Page Layout Formulas Data Review View Help Tell me what you want to do PROTECTED VIEW Be carefulfiles from the Internet can contain viruses. Unless you need to edit, it's safer to stay in Protected View. Enable Editing U1 fr Coca Cola (KO) R S T U V w X Y Z AA AB AC AD AE 26 6626.0 591.6 12/31/1997 4701.0 12/31/1997 814.9 163.6 9/30/1998 1804.0 498.0 27 5772.0 570.5 3/31/1998 4457.0 3/31/1998 778.3 162.6 12/31/1998 1832.0 585.0 28 5065.0 537.7 6/30/1998 5151.0 6/30/1998 755.8 161.0 3/31/1999 1492.0 439.0 29 6158.0 559.0 9/30/1998 4747.0 9/30/1998 912.0 190.1 6/30/1999 1498.0 416.0 30 6590.0 569.2 12/31/1998 4458.0 12/31/1998 799.0 183.3 9/30/1999 1768.0 511.0 561 31 5459.0 561.2 3/31/1999 4428.0 3/31/1999 204 791.1 177.4 12191/1000 12/31/1999 1916.0 551.0 --- 32 6238.0 691.6 55016 6/30/1999 5335.0 6/30/1999 816.8 177.6 3/31/2000 1394.0 457.0 23 33 6263.0 618.3 9/30/1999 5139.0 9/30/1999 950.9 198.9 6/30/2000 1388.0 422.0 34 34 6548.0 609.8 12/31/1999 4410.0 12/31/1999 903.9 196.4 9/30/2000 1778.0 565.0 35 5468.0 581.9 3/31/2000 4256.0 3/31/2000 879.0 184.1 12/31/2000 1957.0 588.0 36 6266.0 b2bb. 56.8 6/30/2000 5487.0 6/30/2000 886.0 000.0 173.1 13. 1439.0 3/31/2001 1459.0 496.0 37 6483.0 VOS. 663.3 9/30/2000 5413.0 9/30/2000 804.9 -17.2 6/30/2001 27.2 1490.0 488.0 6404.0 *010 38 658.9 700.0 . 12/31/2000 4733.0 12/31/2000 947.5 201.4 9/30/2001 1729.0 want 391.0 . 39 5693.0 640.4 3/31/2001 4479.0 www 3/31/2001 1018.0 201.1 12/31/2001 100 1810.0 405.0 40 6263.0 -51.7 6/30/2001 5293.0 2225 6/30/2001 977.0 154.0 3/31/2002 1371.0 382.0 41 6594.0 732.3 9/30/2001 4695.0 9/30/2001 1055.0 151.9 6/30/2002 1223.0 246.0 - 42 6603.0 731.8 12/31/2001 4238.0 12/31/2001 983.0 161.7 9/30/2002 1705.0 378.0 43 5905.0 542.1 3/31/2002 4079.0 3/31/2002 954.6 ** 168.6 12/31/2002 1918.0 457.0 44 6227.0 353.3 *** 6/30/2002 5368.0 6/30/2002 933.8 164.3 3/31/2003 1600.0 con WA003 400.0 45 6802.0 4000 735.1 9/30/2002 5322.0 9/30/2002 1039.0 1520 ACE 157.8 6/30/2003 1455.0 451.0 7232 7232.0 46 528.9 4705 12/31/2002 4795.0 12/31/2002 1018.0 176.0 9/30/2003 1909.0 416.0 47 6379.0 603.1 3/31/2003 4502.0 3/31/2003 1003.0 180.4 12/31/2003 2100.0 476.0 48 4388.0 617.4 6/30/2003 5695.0 6/30/2003 1009.0 173.0 3/31/2004 1667.0 419.0 49 7608.0 644.8 9/30/2003 5671.0 9/30/2003 1170.0 179.3 6/30/2004 1433.0 384.0 50 7364.0 627.0 12/31/2003 5176.0 12/31/2003 1135.0 188.3 9/30/2004 2091.0 443.0 . Shipping Food & Home Homebuilders Oil & Gas Aerospace Heavy Equipment Ready Average 18642.84109 Count: 262 Sum: 4809853 E HE Type here to search O 111 AG 9/30/ 12/31/ 3/31/ 6/30/ 9/30/ 12/31/ 3/31/ 6/30/ 9/30/1 12/31/ 3/31/ 6/30/ 9/30/ 12/31/ 3/31/ 6/30/ 9/30/ 12/31/ 3/31/ 6/30/ 9/30/ 1 12/31/ 3/31/ 6/30/ 9/30/1 Banking 100% e 5:17 PM 7/11/2020 10 Ga Share AF 2278 155. Company Revenues V16 (2) (Protected View] - Excel A Taylor Allen File Home Insert Page Layout Formulas Data Review View Help Tell me what you want to do PROTECTED VIEW Be carefulfiles from the Internet can contain viruses. Unless you need to edit, it's safer to stay in Protected View. Enable Editing U1 fr Coca Cola (KO) R S T U V w X Y Z AA AB AC AD AE 51 6245.0 583.3 3/31/2004 5078,0 3/31/2004 1143.0 194.4 12/31/2004 2223.0 491.0 52 1119,0 116.9 6/30/2004 5914.0 6/30/2004 1156.0 180.6 3/31/2005 1736.0 420.0 53 7063.0 581.8 9/30/2004 5596.0 9/30/2004 1345.0 205.0 6/30/2005 1022.0 326.0 54 4451.0 534.2 12/31/2004 5204.0 2044.0 12/31/2004 1271.0 210.1 9/30/2005 2002.0 443.0 55 3614.0 482.6 3/31/2005 5206.0 2029.0 3/31/2005 1310.0 208.9 12/31/2005 2159.0 500.0 ES 56 3026.0 414.7 4147 6/30/2005 6310.0 2192.0 6/30/2005 1355.0 215.7 3/31/2006 15006 1728.0 1720 431.0 57 3229.0 464.0 9/30/2005 6037.0 2310.0 9/30/2005 1478.0 229.3 6/30/2006 1454.0 446.0 58 58 3805.0 477.7 12/31/2005 5551.0 2293.0 12/31/2005 1416.0 249.7 9/30/2006 2153.0 451.0 59 3526.0 426.2 3/31/2006 5226.0 2060.0 3/31/2006 1365.0 12/31/2006 2064.0 445.0 445.0 60 3606.6 329.7 6/30/2006 6476.0 2327.0 6/30/2006 1407.0 227.4 227.4 3/31/2007 1750.0 405.0 61 3383.0 SOU 410.1 9/30/2006 6454.0 2527.0 9/30/2006 232.1 232.1 6/30/2007 1520.0 431.0 131.0 62 4009.0 433,4 *009.0 12/31/2006 2017 5932.0 5932.0 2657.0 12/31/2006 12/31/2000 1504.0 240.6 9/30/2007 240.0 2185.0 437.0 63 3570,0 505.9 *. www. 3/31/2007 6103.0 2325.0 3/31/2007 1505.0 232.9 100 21 103.4 12/31/2007 2. 2218.0 460.0 64 2879.0 471.0 6/30/2007 7733.0 2685.0 6/30/2007 1520.0 229.1 an 2002 10 3/31/2008 1880.0 442.0 65 2674.0 417.0 - 9/30/2007 7690.0 100 2896.0 9/30/2007 100 1664.0 - 180.2 6/30/2008 1715.0 2000 431.0 66 00 3002.0 450,4 12/31/2007 7331.0 3039.0 12/31/2007 1621.0 144.1 9/30/2008 100 2250.0 447.0 67 2862.0 514.7 3/31/2008 7379.0 2796.0 3/31/2008 1594.0 252.9 sem 12/31/2008 co 453.0 2122.0 000 68 1714.0 460.3 6/30/2008 9046.0 3095.0 6/30/2008 1678.0 135.3 3/31/2009 1686.0 375.0 69 2689.0 437.2 9/30/2008 100 8393.0 3139.0 9/30/2008 1862.0 132.9 2000 6/30/2009 1528.0 393.0 70 3089.0 450.4 12/31/2008 44 7126.0 2744.0 12/31/2008 1689.0 2009 142.5 9/30/2009 24 2203.0 417.0 2010 AER 71 2918.0 450.2 san 3/31/2009 7169.0 2624.0 1 3/31/2009 1595.0 139.9 12/31/2009 2153.0 72 72 1836.0 436.3 6/30/2009 8267.0 2844.0 6/30/2009 142.0 3/31/2010 1802.0 408.0 73 2621.0 381.5 9/30/2009 8044.0 2912.0 9/30/2009 1675.0 142.7 6/30/2010 1518.0 388.0 74 2951.0 489.3 12/31/2009 7510.0 2978.0 12/31/2009 1727.0 145.5 9/30/2010 2172.0 417.0 75 3528.0 494,6 3/31/2010 7525.0 2705.0 3/31/2010 1700.0 146.8 12/31/2010 2127.0 445.0 ... Shipping Food & Home Homebuilders Banking Oil & Gas Aerospace Heavy Equipment Ready Average 18642.84109 Count: 262 Sum: 4809853 E HE Type here to search O 111 AG 12/31/ 3/31/ 6/30/ 9/30/ 12/31/ 3/31/ 6/30/ 9/30/ 12/31/1 3/31/ 6/30/ 9/30/ 12/31/ 3/31/ 6/30/ 9/30/ 12/31/ 3/31/ 6/30/ 9/30/ 12/31/ 3/31/ 6/30/ 9/30/3 12/31/ 450.0 1574.0 100% e 5:17 PM 7/11/2020 10 Ga Share AF 5905.0 151.0 Company Revenues V16 (2) (Protected View] - Excel A Taylor Allen File Home Insert Page Layout Formulas Data Review View Help Tell me what you want to do PROTECTED VIEW Be carefulfiles from the Internet can contain viruses. Unless you need to edit, it's safer to stay in Protected View. Enable Editing U1 fr Coca Cola (KO) R S T U V w X Y Z AA AB AC AD AE 35 5468.0 581.9 3/31/2000 4256.0 3/31/2000 879.0 184.1 12/31/2000 1957.0 588.0 36 6266.0 56.8 6/30/2000 5487.0 6/30/2000 886.0 173.1 3/31/2001 1439.0 496.0 37 6483,0 663.3 9/30/2000 5413.0 9/30/2000 804.9 -17.2 6/30/2001 1490.0 488.0 38 6404.0 658.9 12/31/2000 4733.0 12/31/2000 947.5 201.4 9/30/2001 1729.0 391.0 39 5693.0 640.4 3/31/2001 4479.0 3/31/2001 1018.0 201.1 12/31/2001 1810.0 405.0 40 6263.0 -51.7 6/30/2001 5293.0 6/30/2001 977.0 154.0 3/31/2002 1371.0 382.0 41 6594.0 732.3 7323 9/30/2001 4695.0 9/30/2001 1055.0 151.9 6/30/2002 1223.0 246.0 42 42 6603.0 731.8 7218 12/31/2001 4238.0 12/31/2001 983.0 161.7 9/30/2002 1705.0 378.0 43 542.1 3/31/2002 4079.0 3/31/2002 954.6 168.6 12/31/2002 1918.0 457.0 44 6227.0 353.3 6/30/2002 5368.0 6/30/2002 933.8 164.3 3/31/2003 1600.0 400.0 45 6802.0 735.1 9/30/2002 5322.0 9/30/2002 1039.0 6/30/2003 1455.0 1435.0 451.0 31.0 46 7232.0 120.9 528.9 12/31/2002 12/31/10 4795.0 12/31/2002 1018.0 176.0 9/30/2003 1018.0 110. 1909.0 416.0 *10.4 47 6379.0 603.1 1. 3/31/2003 4502.0 3/31/2003 1003.0 US 180.4 12/31/2003 2100.0 476.0 11...... 48 4388.0 617.4 6/30/2003 5695.0 6/30/2003 1009.0 173.0 3/31/2004 1667.0 419.0 se 49 7608.0 644.8 *** . 9/30/2003 5671.0 9/30/2003 1170.0 179.3 6/30/2004 440 1433.0 384.0 50 7364.0 627.0 12/31/2003 5176.0 2002 3170 12/31/2003 1136.0 188.3 9/30/2004 443.0 110 2091.0 2009 51 6245.0 583.3 wetu 3/31/2004 5078.0 3/31/2004 1143.0 194.4 12/31/2004 To 12 2223.0 491.0 *** 52 - 1119.0 116.9 6/30/2004 5914.0 6/30/2004 1156.0 180.6 3/31/2005 1736.0 s. 420.0 1 53 7063.0 581.8 9/30/2004 5596.0 9/30/2004 1345.0 205.0 6/30/2005 wer 1022.0 326.0 2018 *** 534.2 w 54 4451.0 12/31/2004 5204.0 2044.0 12/31/2004 1271.0 210.1 9/30/2005 10 2002.0 443.0 206 Waldo 482.6 55 3614.0 47400 3/31/2005 5206.0 2029.0 3/31/2005 2000 7100 1310.0 208.9 12/31/2005 2159.0 500.0 56 3026.0 414.7 6/30/2005 2192.0 6/30/2005 1355.0 215.7 3/31/2006 1728.0 431.0 57 3229.0 464.0 9/30/2005 6037.0 2310.0 9/30/2005 1478.0 229.3 6/30/2006 1454.0 446.0 58 3805.0 477.7 12/31/2005 5551.0 2293.0 12/31/2005 1416.0 249.7 9/30/2006 2153.0 451,0 59 3526.0 426,2 3/31/2006 5226.0 2060.0 3/31/2006 1365.0 227.8 12/31/2006 2064.0 445.0 ... Shipping Food & Home Homebuilders Banking Oil & Gas Aerospace Heavy Equipment Ready Average 18642.84109 Count: 262 Sum: 4809853 E HE Type here to search O 111 AG 12/31/ 3/31/ 6/30/ 9/30/ 12/31/ 21217 3/31/ 6/30/ 9/30/ 12/31/ 3/31/ 6/30/ 9/30/ 12/31/ 3/31/ 6/30/ 9/30/ 12/31/ 3/31/1 6/30/ 9/30/ -- 12/31/ 3/31/ 6/30/ 9/30/: 12/31/ 6310.0 100% 5:17 PM 7/11/2020 10 Ga Share AF 2896.0 3/31/2009 s12012011 100.0 AA17.0 Company Revenues V16 (2) (Protected View] - Excel A Taylor Allen File Home Insert Page Layout Formulas Data Review View Help Tell me what you want to do PROTECTED VIEW Be carefulfiles from the Internet can contain viruses. Unless you need to edit, it's safer to stay in Protected View. Enable Editing U1 fr Coca Cola (KO) R S T U V w X Y Z AA AB AC AD AE 60 3606.6 329.7 6/30/2006 6476.0 2327.0 6/30/2006 1407.0 227.4 3/31/2007 1750.0 405.0 61 3383.0 410.1 9/30/2006 6454.0 2527.0 9/30/2006 1557.0 232.1 6/30/2007 1520.0 431.0 62 4009.0 433.4 12/31/2006 5932.0 2657.0 12/31/2006 1504.0 240.6 9/30/2007 2185.0 437.0 63 3570.0 505.9 3/31/2007 6103.0 2325.0 3/31/2007 1505.0 232.9 12/31/2007 2218.0 460.0 64 2879.0 471.0 6/30/2007 7733.0 2685.0 6/30/2007 1520.0 24 229.1 3/31/2008 1880.0 442.0 492 65 2674.0 417.0 9/30/2007 7690.0 9/30/2007 1664.0 -180.2 6/30/2008 1715.0 431.0 GE 66 3002.0 450.4 12/31/2007 7331.0 3039.0 12/31/2007 1621.0 144.1 9/30/2008 2250.0 447.0 67 2862.0 514.7 3/31/2008 7379.0 2796.0 3/31/2008 1594.0 252.9 12/31/2008 2122.0 453.0 68 68 1714.0 460.3 6/30/2008 9046.0 3095.0 6/30/2008 1678.0 135.3 3/31/2009 1686.0 375.0 69 69 2689.0 437.2 9/30/2008 8393.0 3139.0 9/30/2008 1862.0 132.9 6/30/2009 1528.0 393.0 70 3089.0 450.4 434.9 12/31/2008 7126.0 2744.0 2744.0 12/31/2008 1689.0 142.5 142,5 9/30/2009 su/2009 2203.0 417.0 71 2918.0 450.2 10:4 3/31/2009 7169.0 2624.0 1595.0 1930 200 12/31/2009 139.9 2153.0 450.0 APRIL 72 1836.0 436.3 w 6/30/2009 8267.0 2844.0 6/30/2009 1574.0 142.0 3/31/2010 1802.0 408.0 Www 73 2621.0 381.5 9/30/2009 8044.0 2912.0 9/30/2009 142.7 1675.0 1518.0 WOW 6/30/2010 388,0 12 - . 74 2951.0 489.3 12/31/2009 7510.0 2978.0 12/31/2009 1727.0 no 145.5 9/30/2010 2172.0 417.0 75 3528.0 494.6 3/31/2010 7525.0 2018 2705.0 3/31/2010 1700.0 146.8 12/31/2010 2127.0 Town 445.0 ser 76 1568.0 337.5 6/30/2010 8674.0 2878.0 6/30/2010 1730.0 146.5 3/31/2011 1813.0 los 391.0 77 3056.0 368.7 9/30/2010 10 8426.0 3064.0 9/30/2010 2063.0 166.5 6/30/2011 1031.0 233.0 78 3252.0 389.0 12/31/2010 10490.0 4547.0 12/31/2010 1922.0 145.2 9/30/2011 2161.0 406.0 79 Www 3125.0 424.7 3/31/2011 10520.0 100 3/31/2011 1942 4076.0 1959.0 160.1 12/31/2011 2112.0 449.0 2009 80 2993.0 501.2 12740.0 6/30/2011 c11004 1911.0 156.6 3/31/2012 1821.0 09 81 2886.0 421.9 9/30/2011 12250.0 4523.0 9/30/2011 2104.0 156.7 6/30/2012 1081.0 266.0 82 3100.0 456.1 12/31/2011 11040.0 4406.0 12/31/2011 2039.0 152.5 9/30/2012 2205.0 391.0 83 3030.0 418.2 3/31/2012 11140.0 4181.0 3/31/2012 2013.0 148.7 12/31/2012 2162.0 438.0 2998.0 523,2 6/30/2012 13080.0 3150.0 6/30/2012 2008.0 145.0 3/31/2013 1962.0 409.0 ... Shipping Food & Home Homebuilders Banking Oil & Gas Aerospace Heavy Equipment Ready Average 18642.84109 Count: 262 Sum: 4809853 E HE Type here to search O 111 AG 3/31/ 6/30/ 9/30/ 12/31/ 3/31/ 6/30/ 9/30/ 12/31/ 3/31/ 6/30/ 9/30/ 12/31/ 3/31/ 6/30/ 9/30/ 12/31/ 3/31/ 6/30/ 9/30/ 12/31/ 3/31/ 6/30/ 9/30/ 12/31/ 3/31/ 84 100% e 5:18 PM 7/11/2020 10 A Taylor Allen Ga Company Revenues V16 (2) (Protected View] - Excel File Home Insert Page Layout Formulas Data Review View Help Tell me what you want to do i PROTECTED VIEW Be carefulfiles from the Internet can contain viruses. Unless you need to edit, it's safer to stay in Protected View. Share Enable Editing U1 fr Coca Cola (KO) X AB AF AG 6/30/ 9/30/ 12/31/ 3/31/ 6/30/ 9/30/ 85 86 87 88 89 90 91 92 92 93 94 95 96 97 98 99 100 101 102 103 ol soc 105 106 107 108 109 R S T U v 2804.0 410,0 9/30/2012 12340.0 3148.0 428.3 12/31/2012 11460,0 3141.0 404.1 3/31/2013 11040.0 3293.0 256.6 6/30/2013 12750.0 3105.0 406.6 9/30/2013 12030.0 3432.0 438.9 12/31/2013 11040.0 3567 3396.0 356.7 3/31/2014 10580.0 3398.0 778.1 6/30/2014 12570.0 3302.0 450.5 9/30/2014 11980.0 3727.0 493.8 12/31/2014 10870.0 3834.0 3834.0 611.7 3/31/2015 10710.0 2606.0 509.9 6/30/2015 12160.0 2001 3716.0 538.1 9/30/2015 11430.0 4221.0 553.1 12/31/2015 10000.0 *** 3947.0 534,9 3/31/2016 10280.0 3060.0 152.8 6/30/2016 11540.0 2763.0 393.8 9/30/2016 10630.0 w 3136.0 392.0 12/31/2016 9409.0 2907.0 360.3 3/31/2017 04100 9118.0 200 3126.0 399.2 6/30/2017 9702.0 2704 2794.0 405.4 9/30/2017 9078.0 3093.0 524.7 2924.0 489.6 2828.0 789.7 2668.0 281,5 ... Shipping Food & Home Homebuilders Banking w 3362.0 8212.0 2989.0 4385.0 4424.0 -3079.0 2070 3989.0 2639.0 4507.0 -2760.0 2491.0 2717.0 4207.0 -2253.0 2368.0 2407.0 2482.0 2182.0 2034.0 Y 9/30/2012 12/31/2012 3/31/2013 6/30/2013 9/30/2013 12/31/2013 3/31/2014 6/30/2014 9/30/2014 12/31/2014 3/31/2015 6/30/2015 9/30/2015 WW2 12/31/2015 3/31/2016 co 6/30/2016 9/30/2016 sland 12/31/2016 Z 2170.0 2116,0 2153.0 2160.0 2323.0 2243.0 2245.0 2285.0 2544.0 2395.0 2279.0 2189.0 2401.0 2293.0 *** 2300.0 2302.0 . 2628.0 2280.0 2187.0 2207.0 2493.0 AA 159.7 155.8 173.1 151.0 147.4 166.2 165.8 153.0 165.9 180.3 102.7 189.7 184.6 104.0 189.0 210.0 211.1 206.9 244.0 210.2 1040 181.0 176.66 194.22 AC 6/30/2013 9/30/2013 12/31/2013 3/31/2014 6/30/2014 9/30/2014 12/31/2014 3/31/2015 6/30/2015 9/30/2015 12/31/2015 3/31/2016 6/30/2016 9/30/2016 12/31/2016 3/31/2017 6/30/2017 9/30/2017 AD 1723.0 2165.0 2281.0 1970.0 1852.0 2255.0 2234.0 1900.0 1693.0 2203.0 2201.0 . 1870.0 soru 1687.0 2202.0 2171.0 1853.0 1664.0 2161.0 AE 386.0 409.0 410.0 351.0 335.0 374.0 374.0 355.0 382.0 382.0 369.0 302.0 382.0 401.0 351.0 376.0 349.0 229.0 368.0 12/31/ 3/31/. 6/30/ 9/30/ 14131 12/31/ 3/31/ 6/30/ 9/30/ 12/31/1 3/31/ 6/30/ 9/30/ 3/31/2017 104 3142.0 6/30/2017 9/30/2017 3203.0 Oil & Gas Aerospace Heavy Equipment Ready Average: 18642.84109 Count: 262 Sum: 4809853 e 100% HE Type here to search O 111 5:18 PM 7/11/2020 11 Macroeconomic Data (1) (Protected View] - Excel A Taylor Allen Ga Share File Home Insert Page Layout Formulas Data Review View Help Tell me what you want to do PROTECTED VIEW Be carefulfiles from the Internet can contain viruses. Unless you need to edit, it's safer to stay in Protected View. Enable Editing E2 fr v B F H 1 K M N 0 1 Copy and paste your company revenue data from the company revenue file to this column. Pay attention to the date. You need to copy the data starting from 3/31/2000 until 12/31/2016. Then you can copy and paste all data together to Minitab for analysis. 10834.445 A D E Date Price Index Employment percentage GDP in Billions Company Revenue 2 3/31/2000 1.0592 74.3 10278.340 3 6/30/2000 0.7958 73.9 10357.445 4 9/30/2000 0.5392 74.0 10472.285 5 12/31/2000 0.9577 73.9 10508.121 6 3/31/2001 1.0434 73.4 10638.384 7 6/30/2001 0.1314 72.8 10639.486 8 9/30/2001 -0.2813 72.3 10701.317 9 12/31/2001 0.3573 72.2 10 3/31/2002 1.0868 71.9 10934.752 11 6/30/2002 0.4263 71.9 11037.057 12 9/30/2002 12 2002 V.13 0.3138 71.7 11103.834 13 12/31/2002 1.0120 71.5 11230.078 www.ro 14 3/31/2003 2003 0.3643 71.3 11370.653 vie 15 6/30/2003 0.4900 71.0 11625.137 4401 16 9/30/2003 0.0181 71.1 11816.827 . 17 12/31/2003 0.9029 71.2 11988.403 18 3/31/2004 1.4316 71.1 12181.398 . lo 19 6/30/2004 0.3529 71.2 12367.744 . 20 9/30/2004 0.5977 71.3 12562.163 21 12/31/2004 4 1191/2004 7 0.6292 6202 71.3 12813.729 22 3/31/2005 1.3373 71.5 12974.083 23 6/30/2005 1.2168 71.7 13205.445 24 9/30/2005 0.5080 71.6 13381.629 25 12/31/2005 0.5391 71.8 13648.904 Sheet1 100% I Type here to search O 111 5:12 PM 7/11/2020 A Taylor Allen Ga Share v B - L M N 0 71.9 41011 5A60.926 Macroeconomic Data (1) (Protected View] - Excel File Home Insert Page Layout Formulas Data Review View Help Tell me what you want to do PROTECTED VIEW Be carefulfiles from the Internet can contain viruses. Unless you need to edit, it's safer to stay in Protected View. Enable Editing E2 fr A C D E F H 26 3/31/2006 1.6924 13799.794 27 6/30/2006 0.5602 72.1 13908.498 28 9/30/2006 -0.8520 72.2 14066.370 29 12/31/2006 1.0192 72.0 14233.226 30 3/31/2007 1.9173 71.7 14422.313 742 31 6/30/2007 0.2759 71.7 14569.675 22 71 32 9/30/2007 0.7112 71.6 14685.330 33 12/31/2007 1.1368 71.5 14668.445 24 34 3/31/2008 2. 1953 71.2 14812.974 35 6/30/2008 1.1631 70.7 10.7 14842.983 36 9/30/2008 -2.8285 70.0 . 14549.949 37 12/31/2008 -0.4976 68.7 22 Voir 14383.885 38 3/31/2009 1.0603 67.9 14340.417 39 6/30/2009 0.6791 67.3 14384.145 40 9/30/2009 0.2012 66.6 14566.511 1. 41 12/31/2009 0.4014 66.8 14681.063 an 42 3/31/2010 0.4751 66.8 14888.600 43 6/30/2010 0.0933 66.7 15057.660 2010 44 9/30/2010 *** 0.2949 66.5 15230.208 45 12/31/2010 42810 1.2648 66.7 15238.371 46 1.7433 66.5 47 6/30/2011 0.4085 66.6 15587.125 48 9/30/2011 -0.1521 66.8 15785.312 49 12/31/2011 0.7956 67.0 15973.881 50 3/31/2012 0.8275 67.0 16121.851 Sheet1 100% I Type here to search O 111 5:12 PM 7/11/2020 A Taylor Allen Ga Macroeconomic Data (1) (Protected View] - Excel Tell me what you want to do File Home Insert Page Layout Formulas Data Review View Help Share PROTECTED VIEW Be carefulfiles from the Internet can contain viruses. Unless you need to edit, it's safer to stay in Protected View. Enable Editing E2 fr v C E F H - L M N 0 A 46 3/31/2011 47 6/30/2011 48 9/30/2011 49 12/31/2011 50 3/31/2012 51 6/30/2012 52 9/30/2012 53 12/31/2012 54 54 3/31/2013 55 6/30/2013 56 9/30/2013 57 12/31/2013 58 3/31/2014 2011 59 6/30/2014 2017 60 9/30/2014 61 12/31/2014 62 3/31/2015 63 6/30/2015 A 64 9/30/2015 65 12/31/2015 66 3/31/2016 67 6/30/2016 68 9/30/2016 69 12/31/2016 70 Sheet1 B 1.7433 0.4085 -0.1521 0.7956 0.8275 0.2193 0.0360 0.5903 0.5410 0.3780 -0.2791 0.7612 W.1012 1.1809 0.1147 -0.8034 -0.5432 1.2000 0.3000 -0.4000 4000 0.1000 1.2000 0.3000 0.2000 0.8000 66.5 66.6 66.8 67.0 67.0 C 67.1 67A 67.4 67.2 672 67.3 67.5 67.4 07. 67.8 07.0 68,0 68.2 68.5 68.5 68.7 68.7 68.9 69.3 69.2 69.3 69.5 69.8 D 15460.926 15587.125 15785.312 15973.881 16121.851 16227.939 16297.349 16475.440 16541.390 16749.349 16999.888 17031.324 031.324 17320.921 17622.257 eerde 17735.933 17874.715 400 18093.224 18227.689 1024 18287.226 497 18325.187 18538.039 18729.130 18905.545 19057.705 100% I Type here to search O 111 5:12 PM 7/11/2020 ECO 309 Business Forecasting Project Overview 1. In this project, you are writing to a company Strategic Planning VP and other company executives about revenue forecast. 2. Refer to the Revenue data file under Project folder on D2L. This data file provides quarterly revenue for representative companies in the US. You are assigned one company and you can find this information in the grade on D2L. You only need the date and revenue variables. 3. Use Minitab to conduct the analysis and report your finding in the project. Make sure you: Write about what you are showing and why. Remember, Minitab results just support your findings. Lead the reader through your work with written narrative. Remember, you are selling the great work you have done with this report to the executive reader. Guide them carefully through your work. It should logically flow from objective to final revenue forecast and plans. 4. At every stage you need to answer the following questions: What did you do (ex: Winters' method with these parameter values) Why did you do it? What did you find? (Interpretation of your results) What is your conclusion? . . Preparation: First locate your assigned company revenue data in Company Revenue file under Project folder on D2L and download it to your computer. Copay and paste the data into a new Excel file, or you can copy the data to Minitab directly if comfortable with that. There should be two columns. The first column is the date and the second column is the company revenue. You do not need to use the SG&A data. Your data should start with the oldest date and end with the most recent data. Copy and paste the data to Minitab if needed. Make sure you label your data. Make sure you save the Excel file created or the Minitab spreadsheet. You will need to add more data later. Project content: 1. Introduction-Briefly describe the business in general, such the year the company was established, the products/services the company provides, and the location of the headquarter, etc. Then discuss what you are going to do and why. For example, the objective is to develop the best two-year quarterly forecast for company revenues. This is your description of the purpose and use of the forecast and plan. You may add a statement of the value of the objective to the company and its leadership. 2. Data Description--Describe your data; show time series plots and ACF from Minitab; identify the T, C and S components in the data if any. Copy and paste your company revenue data from the company revenue file to this column. Pay attention to the date. You need to copy the data starting from 3/31/2000 until 12/31/2016. Then you can copy and paste all data together to Minitab for analysis


