

Question
Company Coca Cola (Statement Of Cash Flows found below) Identify the MAIN cash flows per category of cash flows and compare them with the previous
Company Coca Cola (Statement Of Cash Flows found below)
Identify the MAIN cash flows per category of cash flows and compare them with the previous year
Critically evaluate the consolidated statement of cash flows and make recommendations for future improvements.
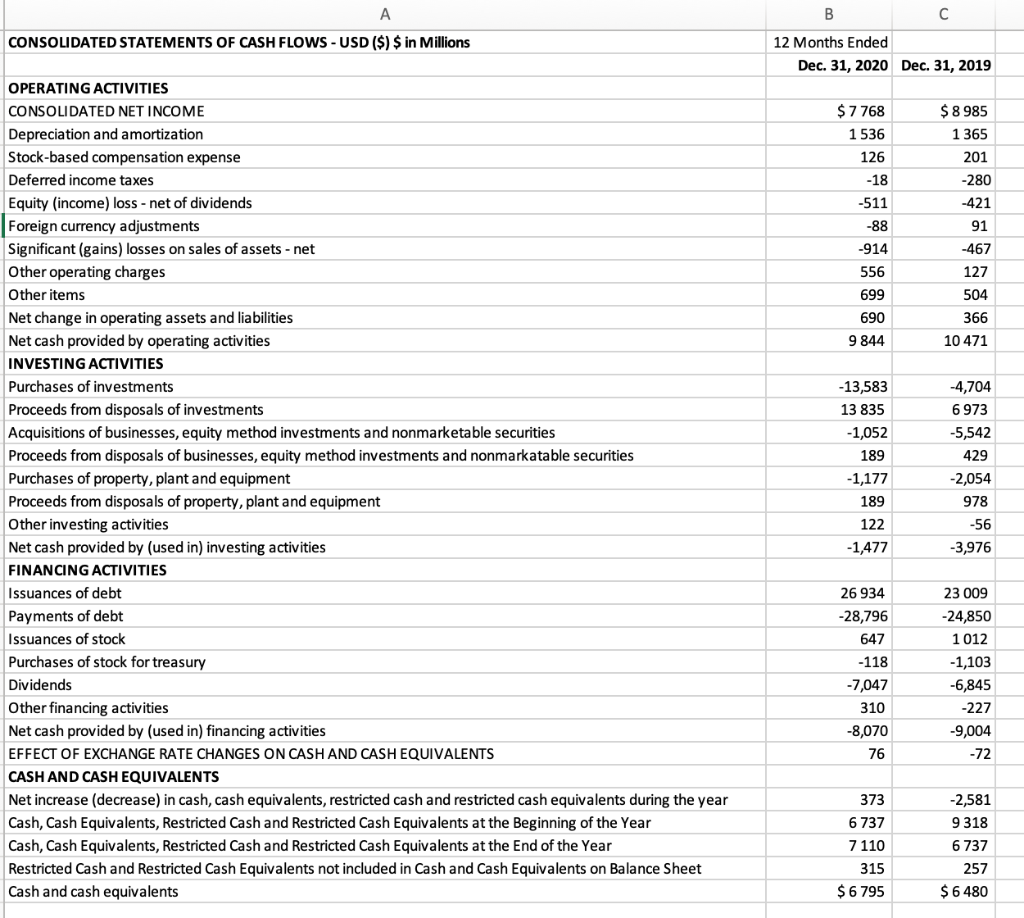
| CONSOLIDATED STATEMENTS OF CASH FLOWS - USD ($) $ in Millions | 12 Months Ended | |
| Dec. 31, 2020 | Dec. 31, 2019 | |
| OPERATING ACTIVITIES | ||
| CONSOLIDATED NET INCOME | $ 7 768 | $ 8 985 |
| Depreciation and amortization | 1 536 | 1 365 |
| Stock-based compensation expense | 126 | 201 |
| Deferred income taxes | -18 | -280 |
| Equity (income) loss - net of dividends | -511 | -421 |
| Foreign currency adjustments | -88 | 91 |
| Significant (gains) losses on sales of assets - net | -914 | -467 |
| Other operating charges | 556 | 127 |
| Other items | 699 | 504 |
| Net change in operating assets and liabilities | 690 | 366 |
| Net cash provided by operating activities | 9 844 | 10 471 |
| INVESTING ACTIVITIES | ||
| Purchases of investments | -13,583 | -4,704 |
| Proceeds from disposals of investments | 13 835 | 6 973 |
| Acquisitions of businesses, equity method investments and nonmarketable securities | -1,052 | -5,542 |
| Proceeds from disposals of businesses, equity method investments and nonmarkatable securities | 189 | 429 |
| Purchases of property, plant and equipment | -1,177 | -2,054 |
| Proceeds from disposals of property, plant and equipment | 189 | 978 |
| Other investing activities | 122 | -56 |
| Net cash provided by (used in) investing activities | -1,477 | -3,976 |
| FINANCING ACTIVITIES | ||
| Issuances of debt | 26 934 | 23 009 |
| Payments of debt | -28,796 | -24,850 |
| Issuances of stock | 647 | 1 012 |
| Purchases of stock for treasury | -118 | -1,103 |
| Dividends | -7,047 | -6,845 |
| Other financing activities | 310 | -227 |
| Net cash provided by (used in) financing activities | -8,070 | -9,004 |
| EFFECT OF EXCHANGE RATE CHANGES ON CASH AND CASH EQUIVALENTS | 76 | -72 |
| CASH AND CASH EQUIVALENTS | ||
| Net increase (decrease) in cash, cash equivalents, restricted cash and restricted cash equivalents during the year | 373 | -2,581 |
| Cash, Cash Equivalents, Restricted Cash and Restricted Cash Equivalents at the Beginning of the Year | 6 737 | 9 318 |
| Cash, Cash Equivalents, Restricted Cash and Restricted Cash Equivalents at the End of the Year | 7 110 | 6 737 |
| Restricted Cash and Restricted Cash Equivalents not included in Cash and Cash Equivalents on Balance Sheet | 315 | 257 |
| Cash and cash equivalents | $ 6 795 | $ 6 480 |
Step by Step Solution
There are 3 Steps involved in it
Step: 1

Get Instant Access to Expert-Tailored Solutions
See step-by-step solutions with expert insights and AI powered tools for academic success
Step: 2

Step: 3
Ace Your Homework with AI
Get the answers you need in no time with our AI-driven, step-by-step assistance
Get Started
Managerial Accounting
Authors: John J. Wild, Ken W. Shaw
2010 Edition
9789813155497, 73379581, 9813155493, 978-0073379586