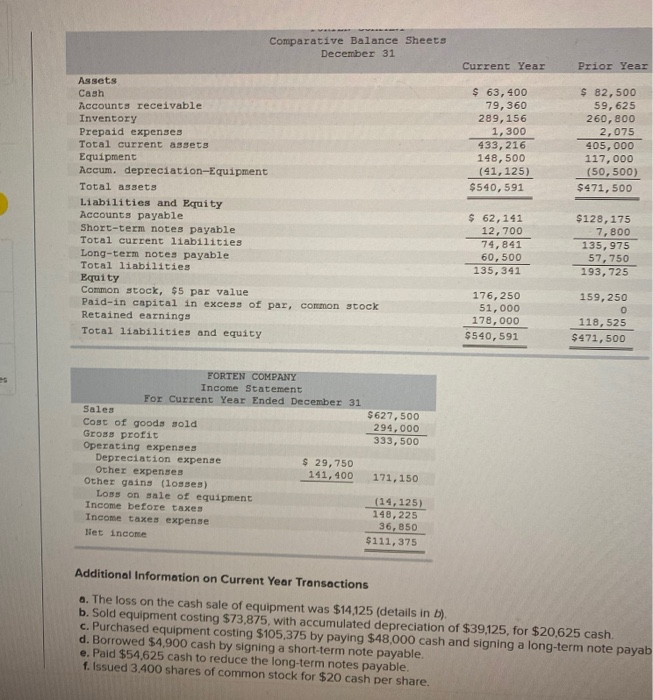
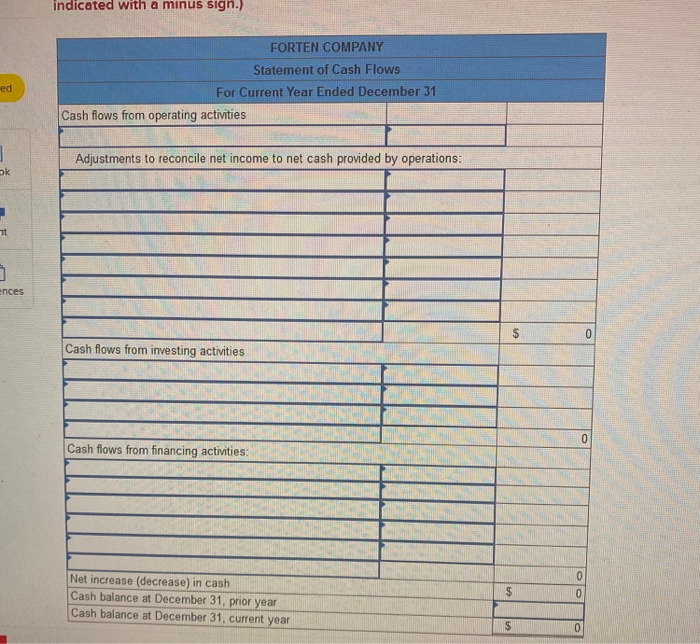
Comparative Balance Sheets December 31 Current Year Prior Year $ 63,400 79, 360 289, 156 1,300 433,216 148,500 (41,125) $540,591 $ 82,500 59, 625 260,800 2,075 405,000 117,000 (50,500) $471, 500 Assets Cash Accounts receivable Inventory Prepaid expenses Total current assets Equipment Accum. depreciation-Equipment Total assets Liabilities and Equity Accounts payable Short-term notes payable Total current liabilities Long-term notes payable Total liabilities Equity Common stock, $5 par value Paid-in capital in excess of par, common stock Retained earnings Total liabilities and equity $ 62,141 12,700 74,841 60, 500 135, 341 $128, 175 7,800 135,975 57,750 193,725 176,250 51,000 178,000 $540,591 159, 250 0 118,525 $471,500 FORTEN COMPANY Income Statement For Current Year Ended December 31 Sales $627, 500 Cost of goods sold 294,000 Gross profit 333,500 Operating expenses Depreciation expense $ 29,750 Other expenses 141,400 171, 150 Other gains (losses) Loss on sale of equipment (14,125) Income before taxes 148, 225 Income taxes expense 36,850 Het income $111,375 Additional Information on Current Year Transactions a. The loss on the cash sale of equipment was $14.125 (details in b). b. Sold equipment costing $73,875, with accumulated depreciation of $39,125, for $20,625 cash c. Purchased equipment costing $105,375 by paying $48,000 cash and signing a long-term note payab d. Borrowed $4,900 cash by signing a short-term note payable. e. Paid $54,625 cash to reduce the long-term notes payable. f. Issued 3.400 shares of common stock for $20 cash per share. indicated with a minus sign.) FORTEN COMPANY Statement of Cash Flows For Current Year Ended December 31 Cash flows from operating activities ed Adjustments to reconcile net income to net cash provided by operations: ok ht ences 0 Cash flows from investing activities Cash flows from financing activities: Net increase (decrease) in cash Cash balance at December 31, prior year Cash balance at December 31, current year 0 $ 0