Answered step by step
Verified Expert Solution
Question
1 Approved Answer
Comparative financial statement data for Blossom Company and Oriole Company, two competitors, appear below. All balance sheet data are as of December 31, 2017 Blossonm
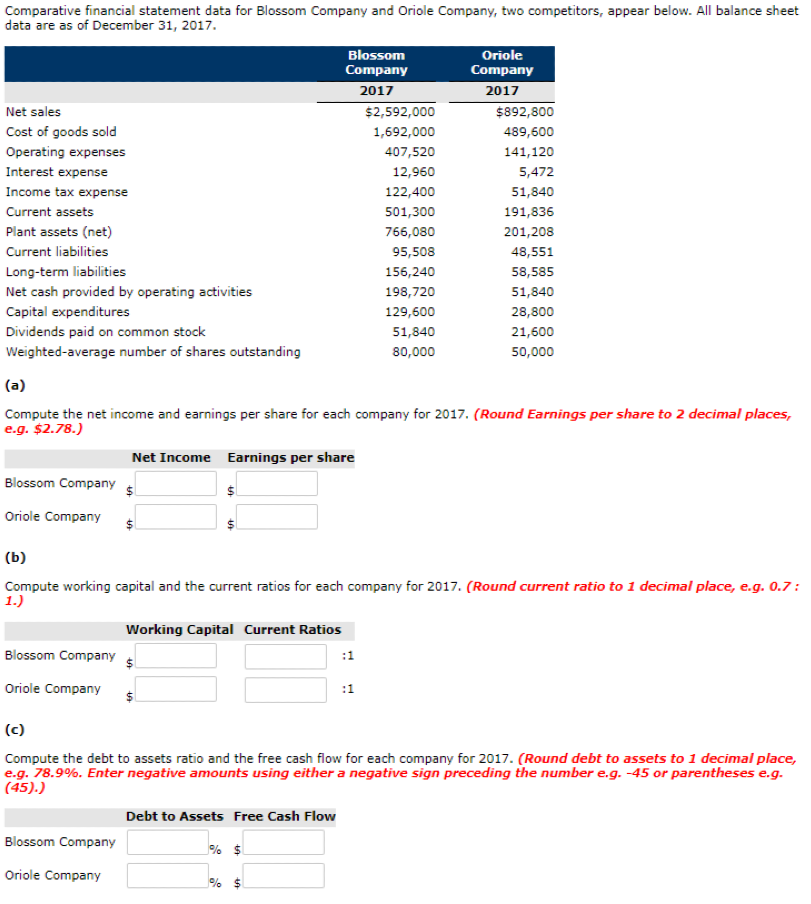
Comparative financial statement data for Blossom Company and Oriole Company, two competitors, appear below. All balance sheet data are as of December 31, 2017 Blossonm Company 2017 Oriole Company 2017 Net sales Cost of goods sold Operating expenses Interest expense Income tax expense Current assets Plant assets (net) Current liabilities Long-term liabilities Net cash provided by operating activities Capital expenditures Dividends paid on common stock Weighted-average number of shares outstanding $2,592,000 1,692,000 407,520 12,960 122,400 501,300 766,080 95,508 156,240 198,720 129,600 51,840 80,000 $892,800 489,600 141,120 5,472 51,840 191,836 201,208 48,551 58,585 51,840 28,800 21,600 50,000 Compute the net income and earnings per share for each company for 2017. (Round Earnings per share to 2 decimal places, e.g. $2.78.) Net Income Earnings per share Blossom Company Oriole Cpany Compute working capital and the current ratios for each company for 2017. (Round current ratio to 1 decimal place, e.g. 0.7 Working Capital Current Ratios Blossom Company Oriole Company Compute the debt to assets ratio and the free cash flow for each company for 2017. (Round debt to assets to 1 decimal place, e.g. 78.9%. Enter negative amounts using either a negative sign preceding the number e.g.-45 or parentheses eg. Debt to Assets Free Cash Flow Blossom Company Oriole Company
Step by Step Solution
There are 3 Steps involved in it
Step: 1
Get Instant Access to Expert-Tailored Solutions
See step-by-step solutions with expert insights and AI powered tools for academic success
Step: 2
Step: 3
Ace Your Homework with AI
Get the answers you need in no time with our AI-driven, step-by-step assistance
Get Started