Question
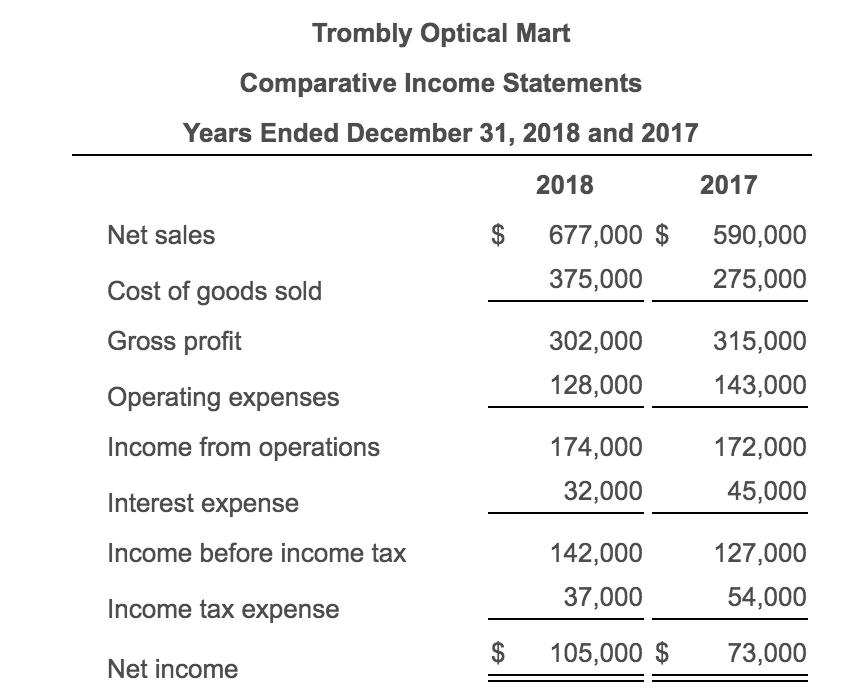
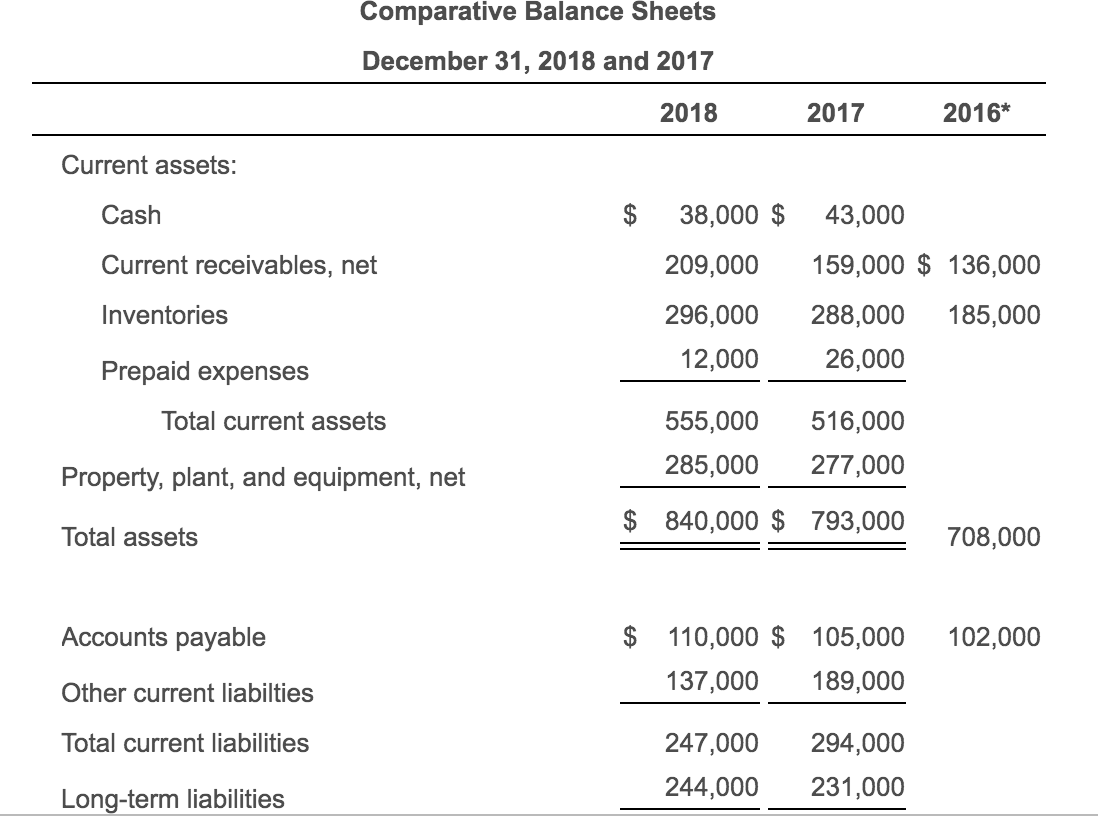
Comparative financial statement data of Trombly Optical Mart follow: Requirements 1. Calculate the following ratios for 2018 and 2017: (Abbreviations used: Avg= average and o/s
Comparative financial statement data of Trombly Optical Mart follow:
Requirements 1. Calculate the following ratios for 2018 and 2017: (Abbreviations used: Avg= average and o/s = outstanding)
a. current ratio
b. Quick ratio
c. Receivables turnover and days' sales outstanding (DSO) -round to the nearest whole day
d. Inventory turnover and days' inventory outstanding (DIO) - round to the nearest whole day
e. Accounts payable turnover and days' payable outstanding (DPO)- use cost of goods sold in the numerator of the turnover ratio and round DPO to the nearest whole day
f. Cash conversion cycle (in days)
g. Times-interest earned ratio
h. Return on assets - use Dupont Analysis
i. Return on common stockholders' equity- use Dupont Analysis
j. Earnings per share of common stock
k. price-earnings ratio
Requirement 2. Decide whether (a) Tombly Optical Mart's financial position improved or deteriorated during 2018 and (b) the investment attractiveness of the company's common stock appears to have increased or decreased from 2017 to 2018.
Requirement 3. How will what you learned in this problem help you evaluate an investment.
Other information:
1. Market price of Trombly Optical Mart common stock: $105.00 at December 31, 2018, and $78.15 at December 31, 2017.
2. Common shares outstanding : 15,000 during 2018 and 14,000 during 2017
3. All sales on credit
4. Cash dividends paid per share :$1.50 in 2018 and $1.00 in 2017.


Trombly Optical Mart Comparative Income Statements Years Ended December 31, 2018 and 2017 2018 2017 $ Net sales Cost of goods sold Gross profit 677,000 $ 375,000 590,000 275,000 302,000 128,000 315,000 143,000 Operating expenses Income from operations 174,000 32,000 172,000 45,000 Interest expense Income before income tax 142,000 37,000 127,000 54,000 Income tax expense $ 105,000 $ 73,000 Net income Comparative Balance Sheets December 31, 2018 and 2017 2018 2017 2016* Current assets: Cash $ 38,000 $ 43,000 159,000 $ 136,000 Current receivables, net 209,000 Inventories 185,000 296,000 12,000 288,000 26,000 Prepaid expenses Total current assets 555,000 285,000 516,000 277,000 Property, plant, and equipment, net $ 840,000 $ 793,000 Total assets 708,000 Accounts payable 102,000 $ 110,000 $ 105,000 137,000 189,000 Other current liabilties Total current liabilities 247,000 244,000 294,000 231,000 Long-term liabilities Total liabilities 491,000 349,000 525,000 268,000 Common stockholders' equity, no par 196,000 $ 840,000 $ 793,000 Total liabilities and stockholders' equity * Selected 2016 amounts
Step by Step Solution
There are 3 Steps involved in it
Step: 1

Get Instant Access to Expert-Tailored Solutions
See step-by-step solutions with expert insights and AI powered tools for academic success
Step: 2

Step: 3

Ace Your Homework with AI
Get the answers you need in no time with our AI-driven, step-by-step assistance
Get Started


