

Question
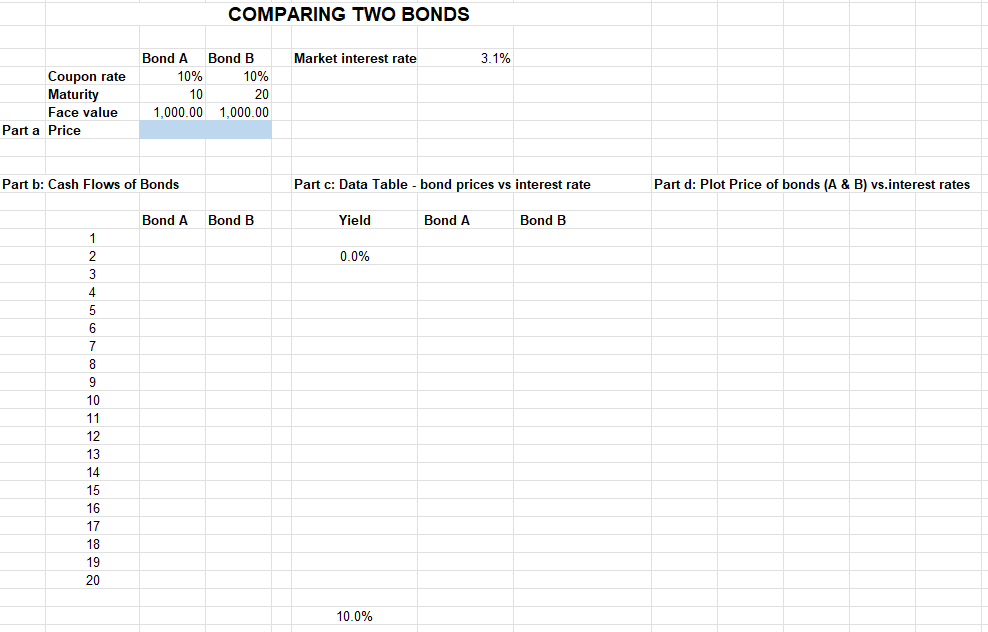
Comparing Bonds a) Find the prices of bonds A and B. b) Sketch out the cash flows of the bonds in a table. c) Create
Comparing Bonds
a) Find the prices of bonds A and B.
b) Sketch out the cash flows of the bonds in a table.
c) Create a data table that shows how the bond prices vary with the interest rate (use 0 to 10%, by 50 basis points).
d) Plot your data table. What do you notice about the shape of the bonds on the plot?
Step by Step Solution
There are 3 Steps involved in it
Step: 1

Get Instant Access to Expert-Tailored Solutions
See step-by-step solutions with expert insights and AI powered tools for academic success
Step: 2

Step: 3
Ace Your Homework with AI
Get the answers you need in no time with our AI-driven, step-by-step assistance
Get Started
Options Trading For Beginners How To Generate Predictable Income And Make A Living Without Taking Big Risks Even If You Re A Complete Beginner
Authors: Greg Middleton
1st Edition
979-8866955046