Answered step by step
Verified Expert Solution
Question
1 Approved Answer
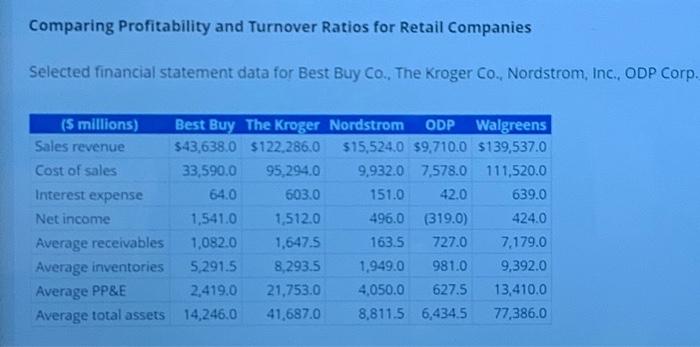
Comparing Profitability and Turnover Ratios for Retail Companies Selected financial statement data for Best Buy Co., The Kroger Co., Nordstrom, Inc., ODP Corp. ($ millions)
Comparing Profitability and Turnover Ratios for Retail Companies Selected financial statement data for Best Buy Co., The Kroger Co., Nordstrom, Inc., ODP Corp. ($ millions) Sales revenue Cost of sales Interest expense Net income Average receivables Average inventories Average PP&E Average total assets Best Buy The Kroger Nordstrom ODP Walgreens $43,638.0 $122,286.0 $15,524.0 $9,710.0 $139,537.0 33,590.0 95,294.0 9,932.0 7,578.0 111,520.0 64.0 603.0 151.0 42.0 639.0 1,541.0 1,512.0 496.0 (319.0) 424.0 1,082.0 1,647.5 163.5 727.0 7,179.0 5,291.5 8,293.5 1,949.0 981.0 9,392.0 2,419.0 21,753.0 4,050.0 627.5 13,410.0 14,246.0 41,687.0 8,811.5 6,434.5 77,386.0


Step by Step Solution
There are 3 Steps involved in it
Step: 1

Get Instant Access to Expert-Tailored Solutions
See step-by-step solutions with expert insights and AI powered tools for academic success
Step: 2

Step: 3

Ace Your Homework with AI
Get the answers you need in no time with our AI-driven, step-by-step assistance
Get Started


