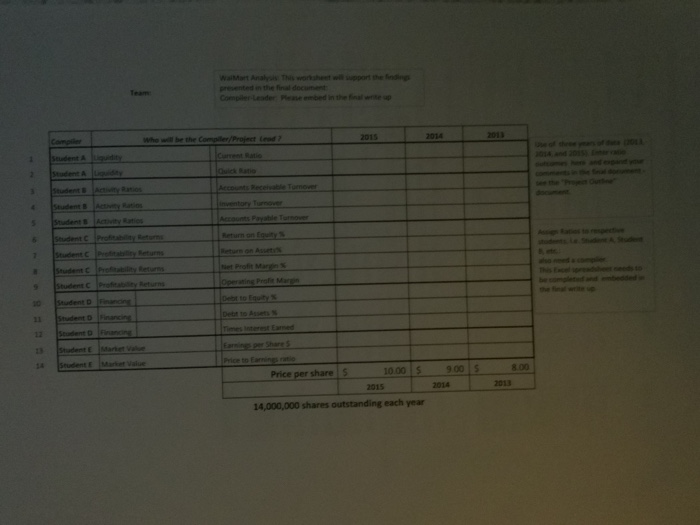
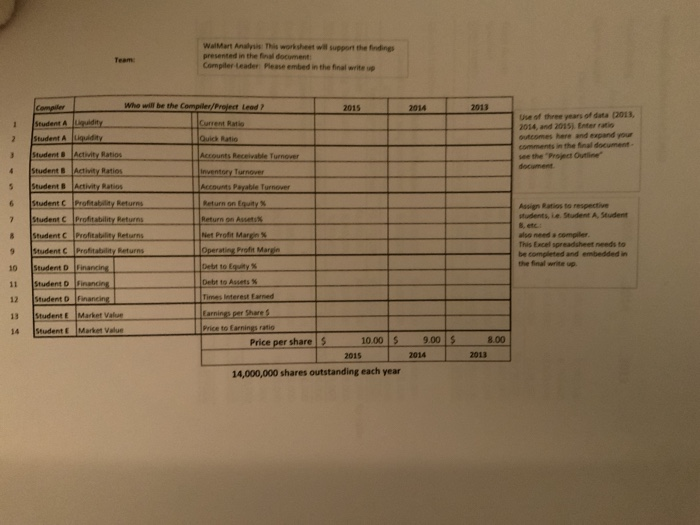
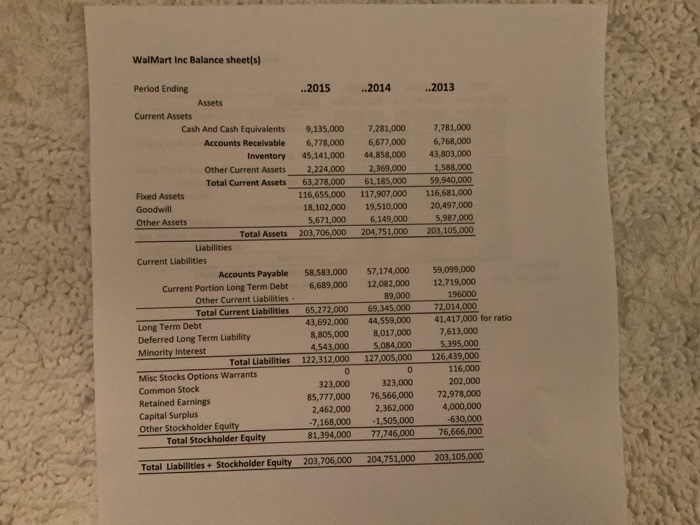
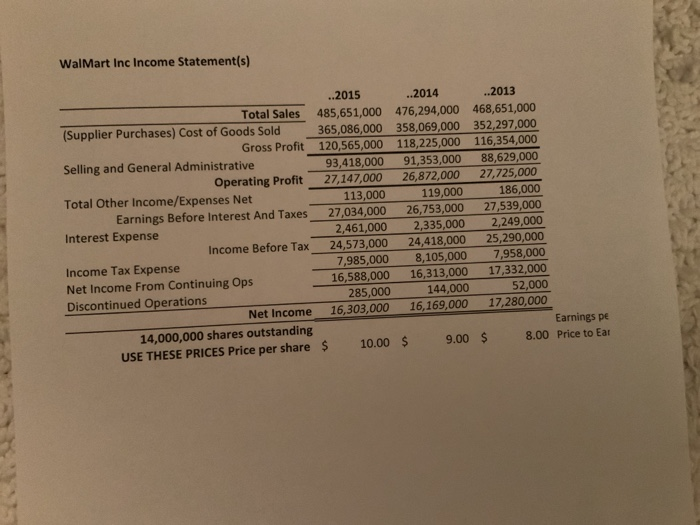
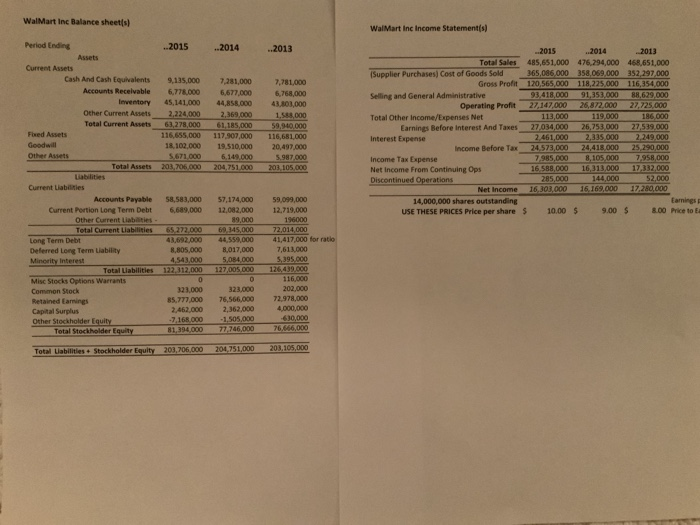
Compiler Leader Penembed in the write c proteabley Returns lope 900 5 8 .00 2013 Price per share S 1000 S 2015 14,000,000 shares outstanding each year Walmart An This worksheet will support the findings presented in the final document: Compiler Leader Please embed in the final write Who will be the Complex/Project Lead? 2015 2014 2013 puidity luty Current Ratio Quick Ratio Use of three years of data 2013 2014 and 20151 Enderrati outcomes here and expand your A unts Payable Turnover Student A Student A Student Student Students Student Student Student student Student Student Student Asian Ratios te respective students, le. Student A Student Activity Ratios Activity Ratios Activity Ratios Profitability Returns Profitability Returns Profitability Returns Profitability Returns Financing Financing Financing Market Value Market Value This Excel spreadsheet needs to be completed and embedded in Return on Equity Return on Ass Net Profit Marga Operatin Profit Marin Debt to Equity Debt to Assets Time interested Carnings per Shares Price to Earnings ratio Price per shares 10.00 $ 2015 14,000,000 shares outstanding each year Student Student $ 8.00 9.00 2014 2013 Walmart Inc Balance sheet(s) 2014 ..2013 7,281,000 6,677,000 44,858,000 2,369,000 61,185,000 117,907,000 19,510,000 6,149,000 204,751,000 7,781,000 6,768,000 43,803,000 1,588,000 59,940,000 116,681,000 20,497,000 5,987,000 203,105,000 Period Ending ..2015 Assets Current Assets Cash And Cash Equivalents 9,135,000 Accounts Receivable 6,778,000 Inventory 45,141,000 Other Current Assets 2,224,000 Total Current Assets 63,278,000 Fixed Assets 116,655,000 Goodwill 18,102,000 Other Assets 5,671,000 Total Assets 203,706,000 Liabilities Current Liabilities Accounts Payable 58,583,000 Current Portion Long Term Debt 6,689,000 Other Current Liabilities - Total Current Liabilities 65,272,000 Long Term Debt 43,692,000 Deferred Long Term Liability 8,805,000 Minority Interest 4,543,000 Total Liabilities 122,312,000 00 Misc Stocks Options Warrants Common Stock 323,000 Retained Earnings 85,777,000 Capital Surplus 2,462,000 Other Stockholder Equity -7,168,000 Total Stockholder Equity 81,394,000 59,099,000 12,719,000 196000 57,174,000 12,082,000 89,000 69,345,000 44,559,000 8,017,000 5,084,000 127.005,000 127.005.000 41,417,000 for ratio 7,613,000 5,395,000 126,439,000 116,000 202,000 72,978,000 4,000,000 -630,000 76,666,000 323,000 76,566,000 2,362,000 -1,505,000 77,746,000 203,706,000 204,751,000 Total Liabilities + Stockholder Equity 203,105,000 Walmart Inc Income Statement(s) ..2015 Total Sales 485,651,000 (Supplier Purchases) Cost of Goods Sold 365,086,000 Gross Profit 120,565,000 Selling and General Administrative 93,418,000 Operating Profit 27,147,000 Total Other Income/Expenses Net 113,000 Earnings Before Interest And Taxes 27,034,000 Interest Expense 2,461,000 Income Before Tax 24,573,000 Income Tax Expense 7,985,000 Net Income From Continuing Ops 16,588,000 Discontinued Operations 285,000 Net Income 16,303,000 14,000,000 shares outstanding USE THESE PRICES Price per share $ 10.00 ..2014 ..2013 476,294,000 468,651,000 358,069,000 352,297,000 118,225,000 116,354,000 91,353,000 88,629,000 26,872,000 27,725,000 119,000 186,000 26,753,000 27,539,000 2,335,000 2,249,000 24,418,000 25,290,000 8,105,000 7,958,000 16,313,000 17,332,000 144,000 52,000 16,169,000 17,280,000 Earnings pe $ 9.00 $ 8.00 Price to Ear Walmart Inc Balance sheets) Walmart Inc Income Statement(s) ..2015 2014 ..2013 Period Ending Assets Current Assets Cash And Cash Equivalents Accounts Receivable Inventory Other Current Assets Total Current Assets Fbed Assets Goodwill Other Assets Total Assets 9,135,000 6.778.000 45,141,000 2,224,000 63,278,000 116.655,000 18.102.000 5,671,000 203,706.000 7,281,000 6,677.000 44,858,000 2,369,000 61,185,000 117,907,000 19.510,000 6.149.000 204,751.000 7,781.000 6,768,000 43.803,000 1.5 .000 59,940,000 116,681 000 20,497.000 5.987000 203 105,000 2015 ..2014 2013 Total Sales 485,651,000 476,294,000 468,651,000 Supplier Purchases) Cost of Goods Sold 365,086,000 358,059.000 352.297.000 Gross Profit 120,565,000 118,225,000 116,354,000 Selling and General Administrative 93.418.000 91,353,000 R8,629.000 Operating Profit 27,147,000 26,872,000 27,725.000 Total Other Income/Expenses Net 113,000 119,000 186.000 Earnings Before Interest And Taxes 27,034,000 26,753.000 27,539,000 Interest Expense 2.461.000 2.335.000 2.249.000 Income Before Tax 24,573,000 24,418,000 25.290.000 Income Tax Expense 7,985,000 8,105.000 7.958.000 Net Income from Continuing Ops 16,588,000 16,313,000 17,332,000 Discontinued Operations 285,000 144,000 $2,000 Net Income 16,303,000 16,169,000 17,280,000 14,000,000 shares outstanding Caming USE THESE PRICES Price per share $ 10.00 $ 9.00 $ 8.00 Price to 58,583,000 6.689,000 59,099,000 12,719,000 Current Liabilities Accounts Payable Current Portion Long Term Debit Other Current Liabilities - Total Current Liabilities Long Term Debt Deferred Long Term Liability Minority interest Total Liabilities Misc Stocks Options Warrants Common Stock Retained Earnings Capital Surplus Other Stockholder Equity Total Stockholder Equity 65.272.000 43.692.000 8.805.000 4,543,000 122,312,000 57,174,000 12.082.000 89,000 69.345,000 44,559,000 8.017,000 5,084,000 127,005.000 72,014,000 41.417.000 for ratio 7,613.000 5.395.000 126,439,000 116.000 202.000 72.978.000 4.000.000 320,000 85.777.000 2.462 000 -7 168.000 81,394.000 32.000 76,566.000 2,362.000 1.505.000 77.746.000 76.666,000 Total abilities. Stockholder Equity 203,706,000 204,751,000 203.105,000