

Answered step by step
Verified Expert Solution
Question
1 Approved Answer
complete the component percentage analysis on the company's statement of earnings that follow. clear pictures of tables Alimentation Couche-Tard Inc. is a leading convenience store
complete the component percentage analysis on the company's statement of earnings that follow.
clear pictures of tables
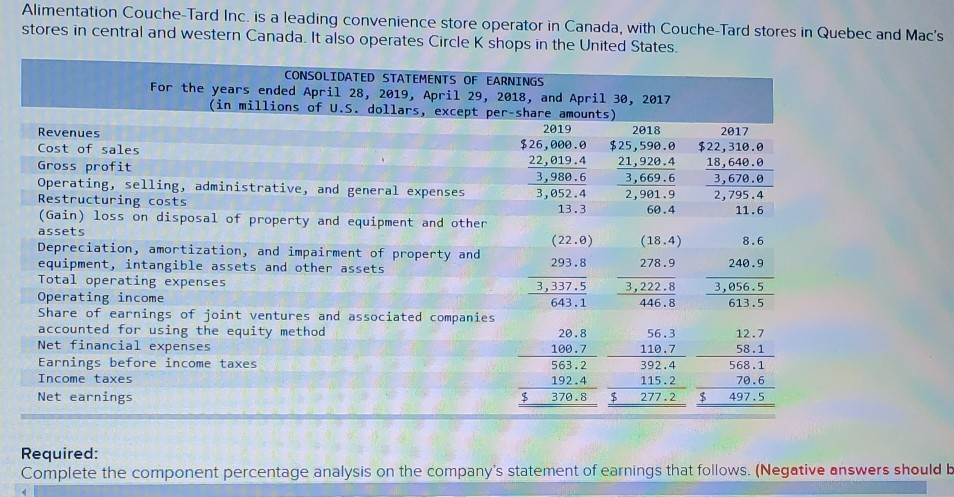
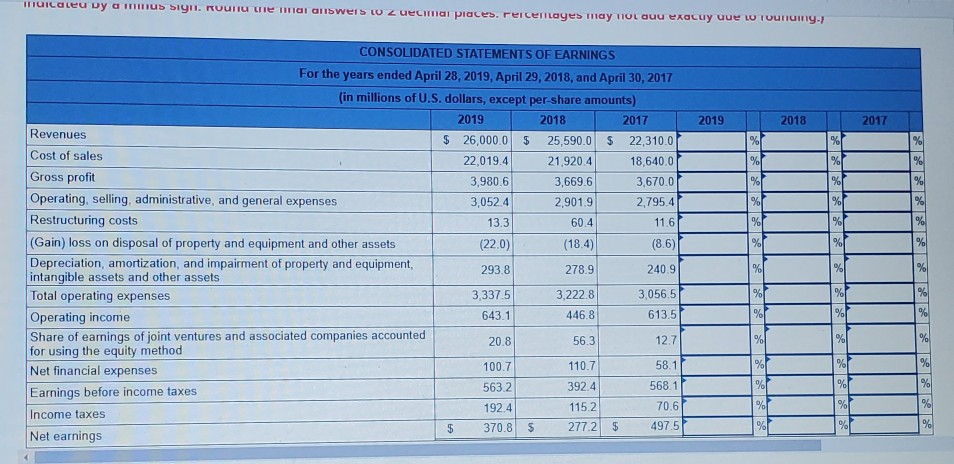
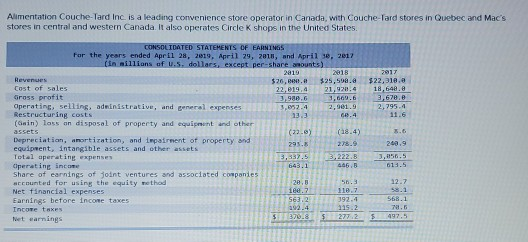
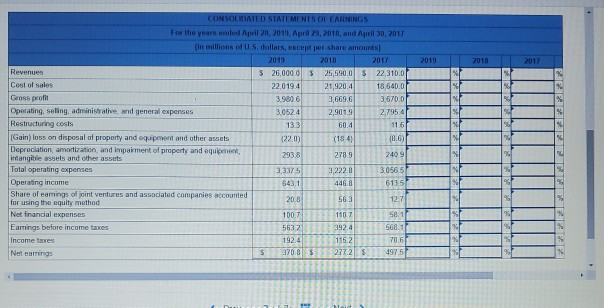
Alimentation Couche-Tard Inc. is a leading convenience store operator in Canada, with Couche-Tard stores in Quebec and Mac's stores in central and western Canada. It also operates Circle K shops in the United States CONSOLIDATED STATEMENTS OF EARNINGS For the years ended April 28, 2019. April 29, 2018, and April 30, 2017 (in millions of u.5. dollars, except per-share amounts) 2019 2018 2017 Revenues $26.9. $25,508.a $22,310.a Cost of sales 22.019.4 21,920.4 18,648. Gross profit 3,988.6 1,669.6 3.620. Operating, selling, administrative, and general expenses 3.652.4 2,795.4 Restructuring costs 13.3 60.4 11.6 (Gain) loss on disposal of property and equipment and other assets (23.0) Depreciation, amortization, and impairment of property and equipment, intangible assets and other assets 293.5 278. 200.9 Total operating expenses 3,137.5 3,222 Operating income 643.1 611,5 Share of earnings of joint ventures and associated companies accounted for using the equity method 20.B 55. 12.7 Net financial expenses 10.7 110.7 58.1 Earnings before income taxes 563.2 392.4 568.1 Incore te 192.4 215.2 78.5 Net warnings $ 370.8 $ 277.21 497.5 2019 2018 2017 NI CONSOLIDATED STATEMENTS OF EARNINGS For the years andled April 20, 2010 April 23, 2010, and April 30, 2017 (in millions of US dollars, except per share amounts) 2019 2018 2017 Revenues $ 26,000.05 25,590.0 5 22 310 | Cost of sales 22.019.4 21,920.4 18,640.0 Gross profit 3.980.6 3,669.6 3,670.0 Operating, seling, administrative and general expenses 3.0524 2,9019 2.7954 Restructuring costs 13.3 60.4 11.61 (Gain) loss on disposal of property and equipment and other assets (220) (184) (0.6) Depreciation, amortization and impairment of property and equipment, 2938 intangible assets and other assets 278.3 2409 Total operating expenses 3,3375 3,2220 3056.5 Operating income 643.1 446.8 613,5 Share of eamings of joint ventures and associated companies accounted for using the equity method 20 8 563 12.7 Net financial expenses 100.7 110.7 58.1 Earings before income taxes 5632 3924 568.1 Income taxes 192.4 115.2 706 Nel carrings $ 270.0 $ 27723 497.5 9 9950 91 % 96 98 Alimentation Couche-Tard Inc. is a leading convenience store operator in Canada, with Couche-Tard stores in Quebec and Mac's stores in central and western Canada. It also operates Circle K shops in the United States. 2017 $22,310.0 18,640.0 3,670.0 2,795.4 11.6 CONSOLIDATED STATEMENTS OF EARNINGS For the years ended April 28, 2019, April 29, 2018, and April 30, 2017 (in millions of U.S. dollars, except per-share amounts) 2019 2018 Revenues $26,000.0 Cost of sales $25,590.0 22,019.4 21,920.4 Gross profit 3,980.6 3,669.6 Operating, selling, administrative, and general expenses 3,052.4 2,901.9 Restructuring costs 13.3 60.4 (Gain) loss on disposal of property and equipment and other assets (22.0) (18.4) Depreciation, amortization, and impairment of property and 293.8 278.9 equipment, intangible assets and other assets Total operating expenses 3,337.5 3,222.8 Operating income 643.1 446.8 Share of earnings of joint ventures and associated companies accounted for using the equity method 20.8 56.3 Net financial expenses 100.7 110.7 Earnings before income taxes 563.2 392.4 Income taxes 192.4 115.2 $ 370.8 $ Net earnings 277.2 8.6 240.9 3,056.5 613.5 12.7 58.1 568.1 70.6 497.5 Required: Complete the component percentage analysis on the company's statement of earnings that follows. (Negative answers should b maicaeu Dyamnus sign. Round the ho answers to Zuecmai places. Percentages may HOLOU exaluy uue w rounomy. CONSOLIDATED STATEMENTS OF EARNINGS 2019 2018 2017 % % % % % % % % % % % % % % % % % % For the years ended April 28, 2019, April 29, 2018, and April 30, 2017 (in millions of U.S. dollars, except per-share amounts) 2019 2018 2017 Revenues $ 26,000.0 $ 25,590.0 S 22,310.0 Cost of sales 22,019.4 21.920.4 18,640.0 Gross profit 3,980.6 3,669.6 3,670.0 Operating, selling, administrative, and general expenses 3,052.4 2,901.9 2,795.4 Restructuring costs 13.3 60.4 11.6 (Gain) loss on disposal of property and equipment and other assets (22.0) (18.4) (8.6) Depreciation, amortization, and impairment of property and equipment, 293.8 278.9 240.9 intangible assets and other assets Total operating expenses 3,337.5 3,222.8 3,056,5 Operating income 643.1 446.8 613.5 Share of earnings of joint ventures and associated companies accounted 20.8 56.3 12.7 for using the equity method Net financial expenses 100.7 110.7 58.1 Earnings before income taxes 563.2 3924 568.1 115.2 192.4 70.6 Income taxes $ 370.8 $ 277.2 $ 497.5 Net earnings % % % % % % % % % % % % % %1 % % % % % % % % % %
Step by Step Solution
There are 3 Steps involved in it
Step: 1

Get Instant Access to Expert-Tailored Solutions
See step-by-step solutions with expert insights and AI powered tools for academic success
Step: 2

Step: 3
Ace Your Homework with AI
Get the answers you need in no time with our AI-driven, step-by-step assistance
Get Started
Payroll Accounting 2021
Authors: Bernard J. Bieg, Judith A. Toland
31st Edition
0357358287, 9780357358283