

Question: Complete the following MATLAB code that implements and plots the Lagrange form of the interpolating polynomial passing through the points: (0.34, 0.26), (0.50, 0.22),
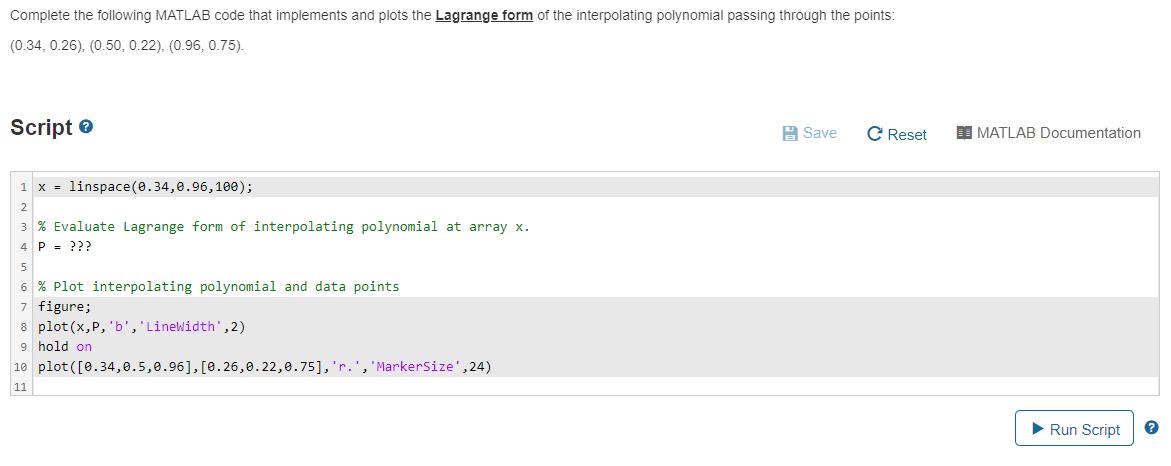
Complete the following MATLAB code that implements and plots the Lagrange form of the interpolating polynomial passing through the points: (0.34, 0.26), (0.50, 0.22), (0.96, 0.75). Script e A Save C Reset I MATLAB Documentation 1 x = linspace(0.34,0.96,10e); 2 3 % Evaluate Lagrange form of interpolating polynomial at array x. 4 P = ??? 5 6 % Plot interpolating polynomial and data points 7 figure; 8 plot (x,P, 'b', 'Linewidth',2) 9 hold on 10 plot([0.34,0.5,0.96],[0.26,0.22,0.75], 'r.', 'MarkerSize',24) 11 > Run Script
Step by Step Solution
3.50 Rating (147 Votes )
There are 3 Steps involved in it
Lagrange Interpolation Formula clc clear syms x format long En... View full answer

Get step-by-step solutions from verified subject matter experts