Answered step by step
Verified Expert Solution
Question
1 Approved Answer
Complete the following steps for the Taxes worksheet: 2. We want to create a one variable data table that will display values of Taxable


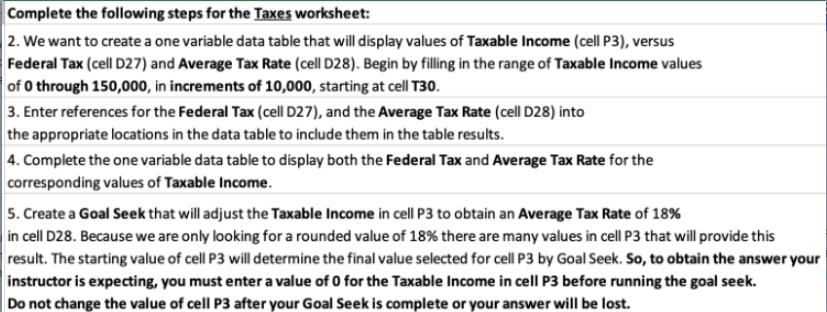
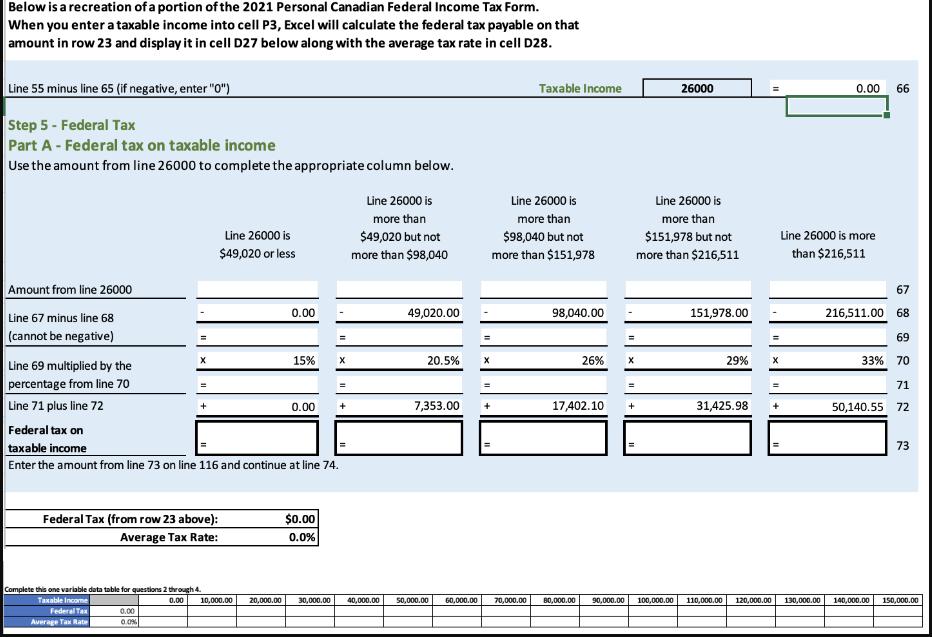
Complete the following steps for the Taxes worksheet: 2. We want to create a one variable data table that will display values of Taxable Income (cell P3), versus Federal Tax (cell D27) and Average Tax Rate (cell D28). Begin by filling in the range of Taxable Income values of 0 through 150,000, in increments of 10,000, starting at cell T30. 3. Enter references for the Federal Tax (cell D27), and the Average Tax Rate (cell D28) into the appropriate locations in the data table to include them in the table results. 4. Complete the one variable data table to display both the Federal Tax and Average Tax Rate for the corresponding values of Taxable Income. 5. Create a Goal Seek that will adjust the Taxable Income in cell P3 to obtain an Average Tax Rate of 18% in cell D28. Because we are only looking for a rounded value of 18% there are many values in cell P3 that will provide this result. The starting value of cell P3 will determine the final value selected for cell P3 by Goal Seek. So, to obtain the answer your instructor is expecting, you must enter a value of 0 for the Taxable Income in cell P3 before running the goal seek. Do not change the value of cell P3 after your Goal Seek is complete or your answer will be lost. Below is a recreation of a portion of the 2021 Personal Canadian Federal Income Tax Form. When you enter a taxable income into cell P3, Excel will calculate the federal tax payable on that amount in row 23 and display it in cell D27 below along with the average tax rate in cell D28. Line 55 minus line 65 (if negative, enter "0") Step 5 - Federal Tax Part A - Federal tax on taxable income Use the amount from line 26000 to complete the appropriate column below. Amount from line 26000 Line 67 minus line 68 (cannot be negative) Line 69 multiplied by the percentage from line 70 Line 71 plus line 72 = X Federal Tax Average Tax Rate + Federal Tax (from row 23 above): Average Tax Rate: 0.00 0.0% Complete this one variable data table for questions 2 through 4. Taxable Income Line 26000 is $49,020 or less Federal tax on taxable income Enter the amount from line 73 on line 116 and continue at line 74. 0.00 0.00 10,000.00 15% X 0.00 $0.00 0.0% Line 26000 is more than $49,020 but not more than $98,040 49,020.00 20.5% X 7,353.00 + Taxable income Line 26000 is more than $98,040 but not more than $151,978 98,040.00 26% = X = Line 26000 is more than $151,978 but not more than $216,511 26000 17,402.10 + 151,978.00 29% X = 31,425.98 + 0.00 66 Line 26000 is more than $216,511 67 216,511.00 68 69 33% 70 71 50,140.55 72 20,000.00 30,000.00 40,000.00 50,000.00 60,000.00 70,000.00 80,000.00 90,000.00 100,000.00 110,000,00 120,000.00 130,000.00 140,000.00 73 150,000.00
Step by Step Solution
★★★★★
3.43 Rating (156 Votes )
There are 3 Steps involved in it
Step: 1
To complete the steps for the Taxes worksheet as described follow these instructions In cell T30 ent...
Get Instant Access to Expert-Tailored Solutions
See step-by-step solutions with expert insights and AI powered tools for academic success
Step: 2

Step: 3

Ace Your Homework with AI
Get the answers you need in no time with our AI-driven, step-by-step assistance
Get Started


