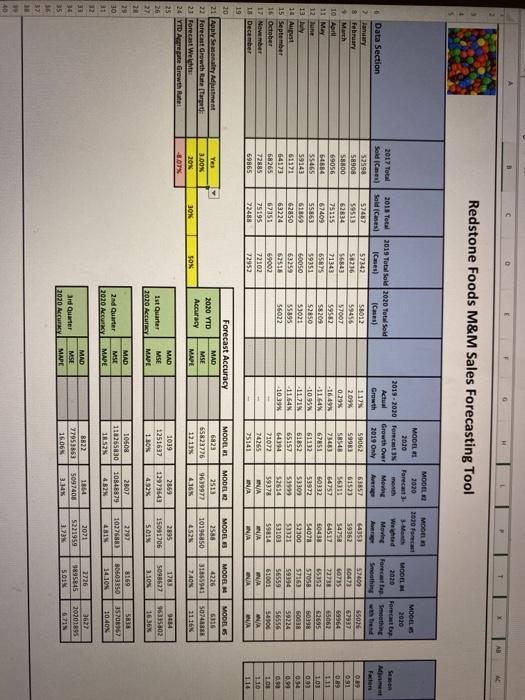
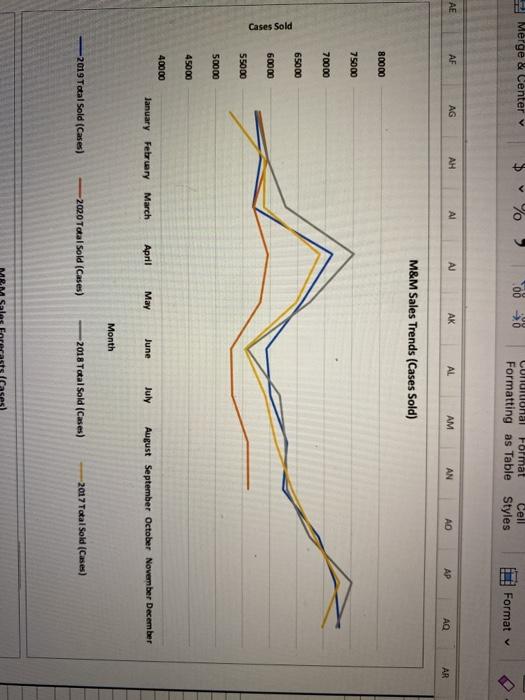
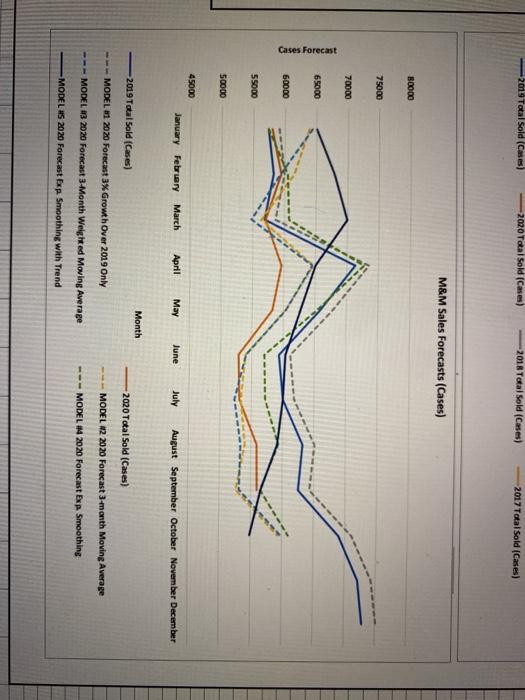
Complete the following tasks in the Excel document. The questions will help you collect data and draw conclusions for your report. 1. Confirm that the following pre-set existing values are present. If they are different, then key in the values below: Apply Seasonality = "No" (Cell B21) Forecast Growth Rate = 3.00% (Cell B22) Forecast Weights = 20% (Cell B23); 30% (Cell C23); 50% (Cell D23) 2. Determine which of the five forecast models performed the best based on MAD, MSE, and MAPE. Think about why the particular model performed the best across the first nine months of the year. 3. We use seasonality adjustment factors to adjust forecasts for the presence of regular movements that relate to recurring events such as holidays. Your team has calculated seasonality adjustment factors in column AC of the Data Section in the spreadsheet. a. Change the value of Cell (B21) from "No" to "Yes" to have the four new forecasting models take seasonality into account 4. Now determine which of the five forecast models performed the best based on MAD, MSE, and MAPE. Think about why the particular model performed the best across the first nine months of the year and include this assessment in your report as part of your recommendation. 5. Create a graph showing MAPE for all five forecasting models across the four specific periods, 2020 YTD, 1st Quarter, 2nd Quarter, and 314 Quarter. Include the figure in your report. Full credit for a chart is contingent on including all of the following, a chart title, legend, X-axis title, and y- axis title. One possible example is the clustered column chart below. Charts are embedded within the text by right-clicking on the chart and selecting the option indicated below D H Redstone Foods M&M Sales Forecasting Tool MODEL 2020 Foreca MODEL 2010 Foreca M Welched Moving 2020 # Data Section 2018 Total Sald Cases Minment MODELS MOOEL 2020 Fortbp Forecast apmething Smoothing 57000 55026 60673 67932 0735 59964 8 February March 10 Arll 11 May 17 une 2017 Total Sold (Cines) 52598 58908 58NDO 69056 54584 55465 59143 61171 64173 68265 72885 59865 2019 Total Sold 2020 Total Sold Cases (Case) 57342 58012 56216 59456 5684 57007 71343 59582 55875 58209 59351 52850 60050 53021 53252 55895 62516 56022 69002 72102 22952 Mowing Aver 63857 61523 56311 54757 50332 57457 59513 62834 75315 67409 55863 61859 628so 63224 62251 75195 72488 MODEL 2010 2019-2010 Forecast Actual Growth Over Growth 2019 Only 1.17% 59062 2.09% 59981 0.29 5854 -16.49% 738 -31.6 67851 -10.95% 61112 11213 61852 11.64% 65157 -10.39% 641 71072 74265 25141 44353 59362 54758 54517 50438 54078 52300 57321 53103 59814 NA NA sisa 57958 57153 59394 089 0.91 089 111 1.03 0.92 0.94 0.99 0.82 53300 5399 52614 59378 NA NA 10 AM 15 September 16 October 17 November 15 December 56559 52695 60398 60038 59224 56556 54500 NA BU 61001 NA NA 110 1 14 19 MODEL Yes Forecast Accuracy MAD 2020 YTD MSE Accuracy MAPE MODEL 2 2513 96 19977 6823 55823776 12.13 MODEL 2588 10196850 452 MOOBS 4226 31855941 740 MODELS 16 5074 2116 3.DON 20 30 SON 4 16% 20 21 Aanly Stenalty Adjustment 22 Forecast Growth Rate Care 21 Forecast Welch 24 YTD Arregate Growth Rute 25 26 27 28 29 30 MAD MSE MAPE ist Quarter 2020 Accu 1039 1251637 110% 2859 12973543 492 2895 15051706 5.01 1783 5098627 9484 96315802 16.36% 3.30 MAD 2nd Quarter 2020 Accu LI 10608 110265830 1852N 2007 10B48879 4.52 2797 10276883 4 RIN 3169 80503350 14.105 5833 3570617 10.40 MAPE BR22 Ord Quarter 2020 ACERY MAD MSE MAPE 7795 1853 16.06 1864 5097401 3.14 2071 5221959 373 2726 985845 501 3627 2020120 GIN Merge & Center v CA % > 008 CUNUNIHal Format Cell Formatting as Table Styles Format AE AF AG AH Al AJ AK AL AM AN AD AP AQ AR M&M Sales Trends (Cases Sold) 80000 75000 70000 65000 Cases Sold 60000 55000 50000 45000 40000 January February March April May June July August September October November December Month -2019Total Sold (Cases) -2020 Total Sold (Cases) -2018Total Sold (Cases) 2017 Total Sold (Cases) 2019 Total Sold (Cases) -2020 Total Sold (Cases) -2018 Total Sold (Cases) 2017 Total Sold (Cases) M&M Sales Forecasts (Cases) 80000 75000 70000 65000 Cases Forecast 60000 55000 50000 45000 January February March April May June July August September October November December Month -2019 Total Sold (Cases) ---MODEL 81 2020 Forecast 3% Growth Over 2019 Only 2020 Total Sold (Cases) MODEL 2 2020 Forecast 3-month Moving Average --- MODEL#4 2020 Forecast Exp Smoothing --- MODEL #3 2020 Forecast 3 Month Weighted Moving Average MODEL US 2020 Forecast Exp. Smoothing with Trend Complete the following tasks in the Excel document. The questions will help you collect data and draw conclusions for your report. 1. Confirm that the following pre-set existing values are present. If they are different, then key in the values below: Apply Seasonality = "No" (Cell B21) Forecast Growth Rate = 3.00% (Cell B22) Forecast Weights = 20% (Cell B23); 30% (Cell C23); 50% (Cell D23) 2. Determine which of the five forecast models performed the best based on MAD, MSE, and MAPE. Think about why the particular model performed the best across the first nine months of the year. 3. We use seasonality adjustment factors to adjust forecasts for the presence of regular movements that relate to recurring events such as holidays. Your team has calculated seasonality adjustment factors in column AC of the Data Section in the spreadsheet. a. Change the value of Cell (B21) from "No" to "Yes" to have the four new forecasting models take seasonality into account 4. Now determine which of the five forecast models performed the best based on MAD, MSE, and MAPE. Think about why the particular model performed the best across the first nine months of the year and include this assessment in your report as part of your recommendation. 5. Create a graph showing MAPE for all five forecasting models across the four specific periods, 2020 YTD, 1st Quarter, 2nd Quarter, and 314 Quarter. Include the figure in your report. Full credit for a chart is contingent on including all of the following, a chart title, legend, X-axis title, and y- axis title. One possible example is the clustered column chart below. Charts are embedded within the text by right-clicking on the chart and selecting the option indicated below D H Redstone Foods M&M Sales Forecasting Tool MODEL 2020 Foreca MODEL 2010 Foreca M Welched Moving 2020 # Data Section 2018 Total Sald Cases Minment MODELS MOOEL 2020 Fortbp Forecast apmething Smoothing 57000 55026 60673 67932 0735 59964 8 February March 10 Arll 11 May 17 une 2017 Total Sold (Cines) 52598 58908 58NDO 69056 54584 55465 59143 61171 64173 68265 72885 59865 2019 Total Sold 2020 Total Sold Cases (Case) 57342 58012 56216 59456 5684 57007 71343 59582 55875 58209 59351 52850 60050 53021 53252 55895 62516 56022 69002 72102 22952 Mowing Aver 63857 61523 56311 54757 50332 57457 59513 62834 75315 67409 55863 61859 628so 63224 62251 75195 72488 MODEL 2010 2019-2010 Forecast Actual Growth Over Growth 2019 Only 1.17% 59062 2.09% 59981 0.29 5854 -16.49% 738 -31.6 67851 -10.95% 61112 11213 61852 11.64% 65157 -10.39% 641 71072 74265 25141 44353 59362 54758 54517 50438 54078 52300 57321 53103 59814 NA NA sisa 57958 57153 59394 089 0.91 089 111 1.03 0.92 0.94 0.99 0.82 53300 5399 52614 59378 NA NA 10 AM 15 September 16 October 17 November 15 December 56559 52695 60398 60038 59224 56556 54500 NA BU 61001 NA NA 110 1 14 19 MODEL Yes Forecast Accuracy MAD 2020 YTD MSE Accuracy MAPE MODEL 2 2513 96 19977 6823 55823776 12.13 MODEL 2588 10196850 452 MOOBS 4226 31855941 740 MODELS 16 5074 2116 3.DON 20 30 SON 4 16% 20 21 Aanly Stenalty Adjustment 22 Forecast Growth Rate Care 21 Forecast Welch 24 YTD Arregate Growth Rute 25 26 27 28 29 30 MAD MSE MAPE ist Quarter 2020 Accu 1039 1251637 110% 2859 12973543 492 2895 15051706 5.01 1783 5098627 9484 96315802 16.36% 3.30 MAD 2nd Quarter 2020 Accu LI 10608 110265830 1852N 2007 10B48879 4.52 2797 10276883 4 RIN 3169 80503350 14.105 5833 3570617 10.40 MAPE BR22 Ord Quarter 2020 ACERY MAD MSE MAPE 7795 1853 16.06 1864 5097401 3.14 2071 5221959 373 2726 985845 501 3627 2020120 GIN Merge & Center v CA % > 008 CUNUNIHal Format Cell Formatting as Table Styles Format AE AF AG AH Al AJ AK AL AM AN AD AP AQ AR M&M Sales Trends (Cases Sold) 80000 75000 70000 65000 Cases Sold 60000 55000 50000 45000 40000 January February March April May June July August September October November December Month -2019Total Sold (Cases) -2020 Total Sold (Cases) -2018Total Sold (Cases) 2017 Total Sold (Cases) 2019 Total Sold (Cases) -2020 Total Sold (Cases) -2018 Total Sold (Cases) 2017 Total Sold (Cases) M&M Sales Forecasts (Cases) 80000 75000 70000 65000 Cases Forecast 60000 55000 50000 45000 January February March April May June July August September October November December Month -2019 Total Sold (Cases) ---MODEL 81 2020 Forecast 3% Growth Over 2019 Only 2020 Total Sold (Cases) MODEL 2 2020 Forecast 3-month Moving Average --- MODEL#4 2020 Forecast Exp Smoothing --- MODEL #3 2020 Forecast 3 Month Weighted Moving Average MODEL US 2020 Forecast Exp. Smoothing with Trend