

Answered step by step
Verified Expert Solution
Question
1 Approved Answer
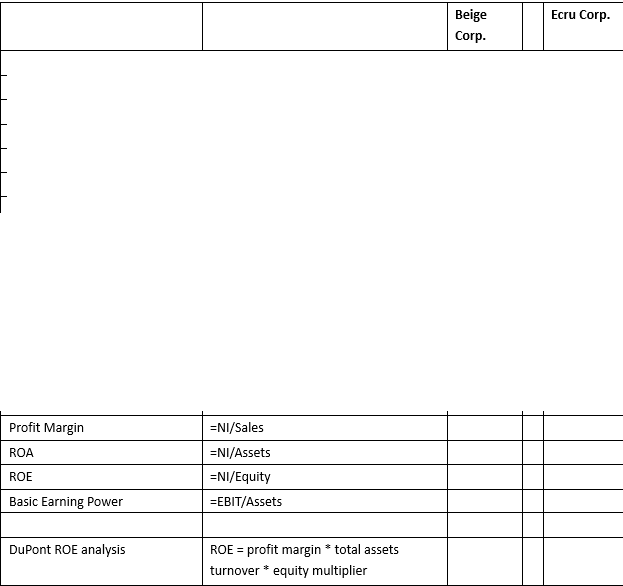
COMPLETE THE FOLLOWING USING THE CHART ABOVE Income Statements for Year Ended 12/31/200:3 (amounts in $ millions) Sale Beige Corp 247.80 (183.80) 37.50 (10.00) 16.50
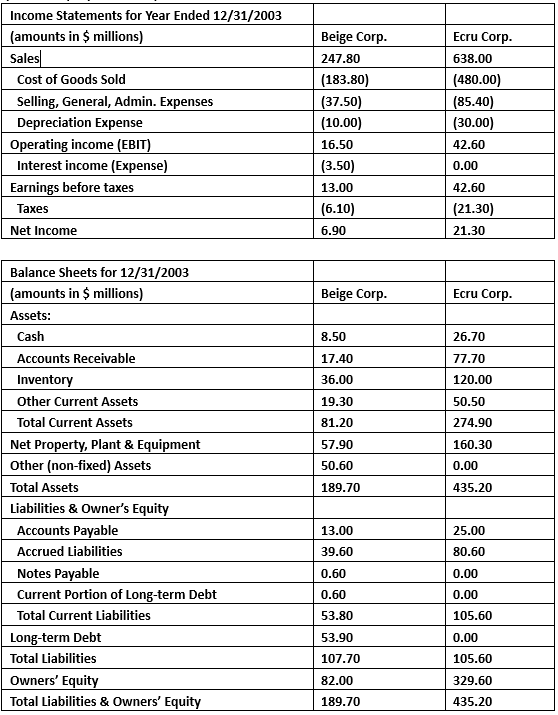
COMPLETE THE FOLLOWING USING THE CHART ABOVE
Step by Step Solution
There are 3 Steps involved in it
Step: 1

Get Instant Access to Expert-Tailored Solutions
See step-by-step solutions with expert insights and AI powered tools for academic success
Step: 2

Step: 3
Ace Your Homework with AI
Get the answers you need in no time with our AI-driven, step-by-step assistance
Get Started
The Social Profit Handbook
Authors: David Grant
1st Edition
1603586040, 978-1603586047