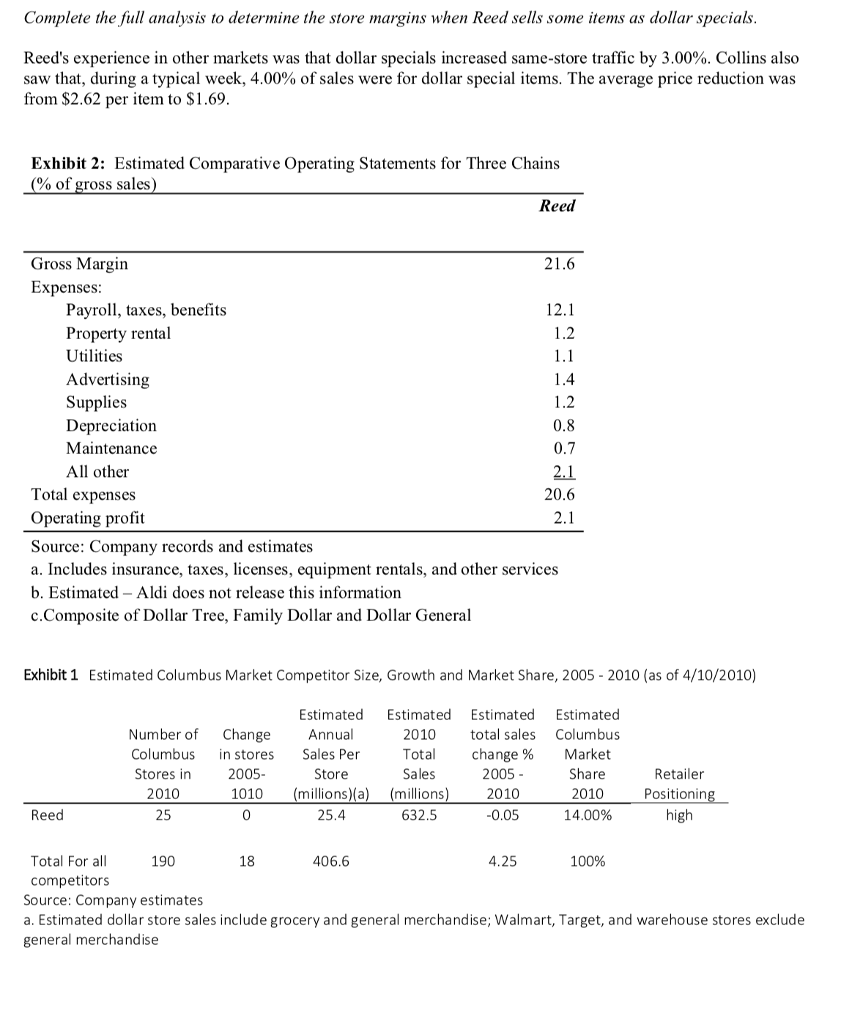
Complete the full analysis to determine the store margins when Reed sells some items as dollar specials Ree s experience in other markets was that dollar specials increased same-store traffic by 3.00%. Collins also saw that, during a typical week, 4.00% of sales were for dollar special items. The average price reduction was from $2.62 per item to $1.69 Exhibit 2: Estimated Comparative Operating Statements for Three Chains % of gross sales Reed Gross Margin Expenses 21.6 12.1 1.2 Payroll, taxes, benefits Property rental Utilities Advertising Supplies Depreciation Maintenance All other 1.2 0.8 2.1 20.6 Total expenses Operating profit Source: Company records and estimates a. Includes insurance, taxes, licenses, equipment rentals, and other services b, Estimated-Aldi does not release this information c.Composite of Dollar Tree, Family Dollar and Dollar General Exhibit 1 Estimated Columbus Market Competitor Size, Growth and Market Share, 2005 2010 (as of 4/10/2010) Estimated Estimated Estimated Estimated Number of Change Annual 2010 total sales Columbus Columbus in stores Sales Per 2005 Total change % Market 2005- 2010 0.05 Retailer Positionin high Store Sales Stores in 2010 25 1010 (millions)(a) (millions 25.4 Share 2010 14.00% Reed 0 632.5 Total For all 18 406.6 4.25 100% competitors Source: Company estimates a. Estimated dollar store sales include grocery and general merchandise; Walmart, Target, and warehouse stores exclude general merchandise Complete the full analysis to determine the store margins when Reed sells some items as dollar specials Ree s experience in other markets was that dollar specials increased same-store traffic by 3.00%. Collins also saw that, during a typical week, 4.00% of sales were for dollar special items. The average price reduction was from $2.62 per item to $1.69 Exhibit 2: Estimated Comparative Operating Statements for Three Chains % of gross sales Reed Gross Margin Expenses 21.6 12.1 1.2 Payroll, taxes, benefits Property rental Utilities Advertising Supplies Depreciation Maintenance All other 1.2 0.8 2.1 20.6 Total expenses Operating profit Source: Company records and estimates a. Includes insurance, taxes, licenses, equipment rentals, and other services b, Estimated-Aldi does not release this information c.Composite of Dollar Tree, Family Dollar and Dollar General Exhibit 1 Estimated Columbus Market Competitor Size, Growth and Market Share, 2005 2010 (as of 4/10/2010) Estimated Estimated Estimated Estimated Number of Change Annual 2010 total sales Columbus Columbus in stores Sales Per 2005 Total change % Market 2005- 2010 0.05 Retailer Positionin high Store Sales Stores in 2010 25 1010 (millions)(a) (millions 25.4 Share 2010 14.00% Reed 0 632.5 Total For all 18 406.6 4.25 100% competitors Source: Company estimates a. Estimated dollar store sales include grocery and general merchandise; Walmart, Target, and warehouse stores exclude general merchandise


