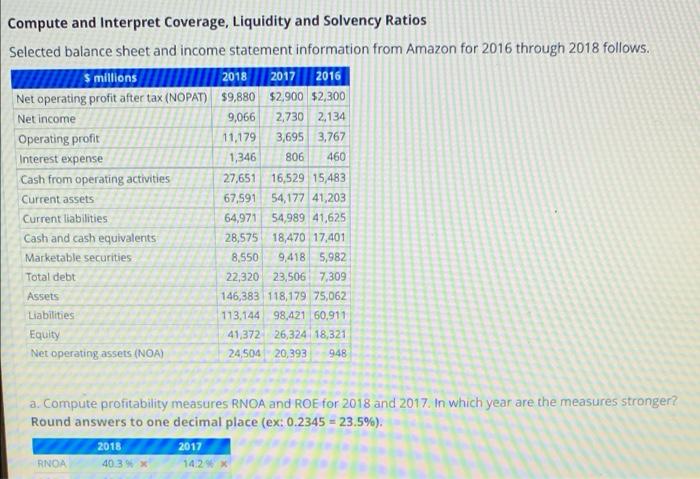
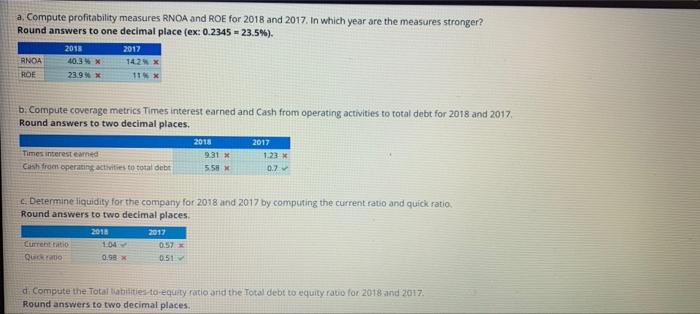
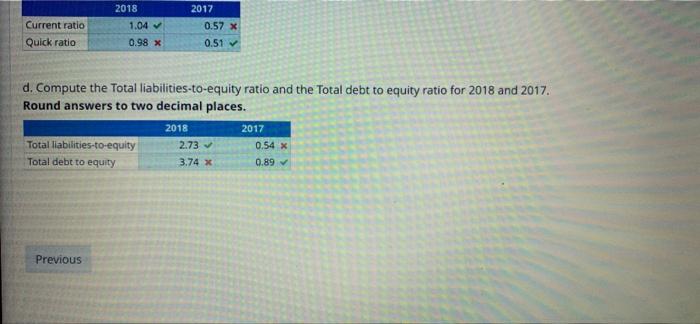
Compute and Interpret Coverage, Liquidity and Solvency Ratios Selected balance sheet and income statement information from Amazon for 2016 through 2018 follows. $ millions 2018 2017 2016 Net operating profit after tax (NOPAT) $9,880 $2,900 $2,300 Net income 9,066 2,730 2,134 Operating profit 11,179 3,695 3,767 Interest expense 1,346 806 460 Cash from operating activities 27,651 16,529 15,483 Current assets 67,591 54,177 41,203 Current liabilities 64,971 54,989 41,625 Cash and cash equivalents 28,575 18,470 17,401 Marketable securities 8,550 9,418 5,982 Total debt 22,320 23,506 7,309 Assets 146,383 118,179 75,062 Liabilities 113.144 98,421 60,911 Equity 41,372 26,324 18,321 Net operating assets (NOA) 24,504 20,393 948 a. Compute profitability measures RNCA and ROE for 2018 and 2017. In which year are the measures stronger? Round answers to one decimal place (ex: 0.2345 = 23.5%). 2018 40.3% X 2017 14.2 RNOA a. Compute profitability measures RNOA and ROE for 2018 and 2017. In which year are the measures stronger? Round answers to one decimal place (ex: 0.2345 - 23.5%). 2018 2017 142 RNOA ROE 23.9 X b. Compute coverage metrics Times interest earned and Cash from operating activities to total debt for 2018 and 2017 Round answers to two decimal places. 2018 2017 Times interest earned 9.31 1.23 Cash from operating activities to total debt 558 0.7 4. Determine liquidity for the company for 2018 and 2017 by computing the current ratio and quick ratio. Round answers to two decimal places 2018 2012 Current to 104 0.57 x Quarto 0.98 0:51 di Compute the Total abilities to equity ratio and the Total debt to equity ratio for 2018 and 2017 Round answers to two decimal places. Current ratio Quick ratio 2018 1.04 0.98 x 2017 0.57 X 0.51 d. Compute the Total liabilities-to-equity ratio and the Total debt to equity ratio for 2018 and 2017. Round answers to two decimal places. Total liabilities-to-equity Total debt to equity 2018 2.73 3.74 X 2017 0.54 X 0.89 Previous