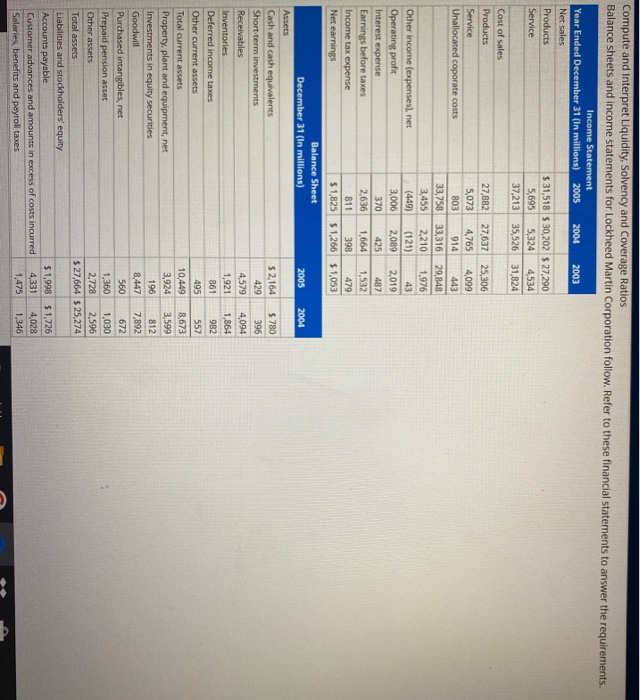
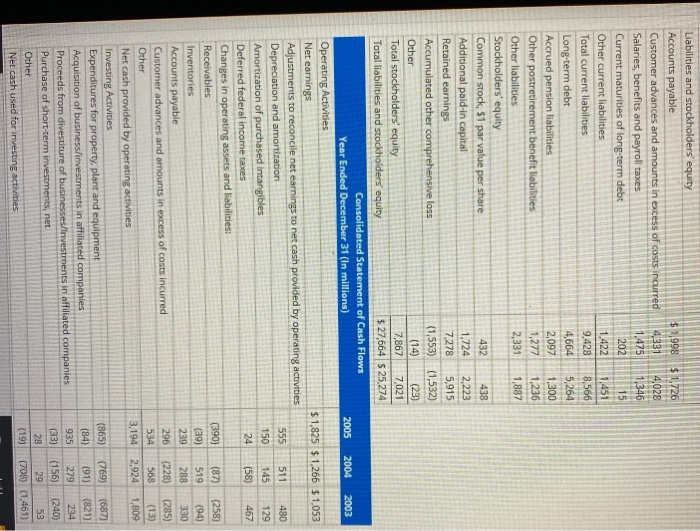
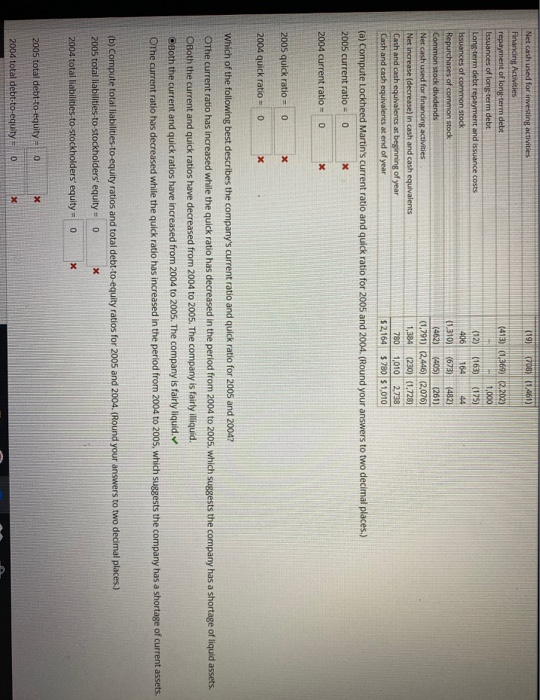
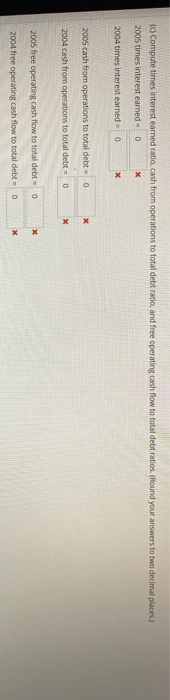
Compute and interpret Liquidity, Solvency and Coverage Ratios Balance sheets and income statements for Lockheed Martin Corporation follow. Refer to these financial statements to answer the requirements. Income Statement Year Ended December 31 (In millions) 2005 2004 2003 Net sales Products $ 31,518 $30,202 $ 27,290 Service 5,695 5,324 4534 37,213 35,526 31,824 Cost of sales Products 27,882 27,637 25,306 Service 5,073 4,765 4,099 Unallocated coporate costs 803 914 443 33,758 33,316 29,848 3,455 2,210 1.976 Other Income (expenses), net (449) (121) 43 Operating profit 3,006 2,089 2,019 Interest expense 370 425 487 Earnings before taxes 2,636 1,664 1,532 Income tax expense 811 398 479 Net earnings $ 1,825 $1,266 $1,053 2005 2004 Balance Sheet December 31 (In millions) Assets Cash and cash equivalents Short-term investments Receivables Inventories Deferred income taxes Other current assets Total current assets Property, plant and equipment, net Investments in equity securities Goodwill Purchased intangibles, net Prepaid pension asset Other assets Total assets Liabilities and stockholders' equity Accounts payable Customer advances and amounts in excess of costs incurred Salaries, benefits and payroll taxes $ 2,164 $ 780 429 396 4,579 4,094 1,921 1,864 861 982 495 557 10,449 8,673 3,924 3,599 196 812 8,447 7,892 560 672 1,360 1,030 2,728 2,596 $ 27,664 $25,274 $1.998 4,331 1,475 $1,726 4,028 1,346 202 1,451 4,664 2,097 1.277 432 Liabilities and stockholders equity Accounts payable $ 998 $ 1,726 Customer advances and amounts in excess of costs incurred 4,331 4,028 Salaries, benefits and payroll taxes 1.4751 346 Current maturities of long-term debt Other current liabilities Total current liabilities 9,428 8,566 Long-term debt 5,264 Accrued pension liabilities 1,300 Other postretirement benefit liabilities 1,236 Other liabilities 2,331 1,887 Stockholders' equity Common stock, 51 par value per share 438 Additional paid-in capital 1,724 2.223 Retained earnings 7,278 5,915 Accumulated other comprehensive lo (1,553) (1,532) Other (14) (23) Total stockholders' equity 7,867 7021 Total liabilities and stockholders equity $ 27,664 $ 25,274 Consolidated Statement of Cash Flows Year Ended December 31 (in millions) 2005 2004 2003 Operating Activities Net earnings $ 1,825 $1,266 $1,053 Adjustments to reconcile net earnings to net cash provided by operating activities Depreciation and amortization 555511 480 Amortization of purchased intangibles 145 129 Deferred federal income tas 467 Changes in operating assets and liabilities: Receivables Inventories 519 (90 Accounts payable 288 330 Customer advances and amounts in excess of costs incurred 296 (228) (285) Other 534 568 (13) Net cash provided by operating activities 3.194 2,924 1,809 Investing Activities Expenditures for property, plant and equipment (865) (769) (687) Acquisition of business/investments in affiliated companies (84) (91) (821) Proceeds from divestiture of businesses/Investments in affiliated companies 935 279 234 Purchase of short-term investments, net (33) (156) (240) Other 28 53 Net cash used for investing activities (708) (1.461) (87 (259) (19 708) (1,461) Net cash used for investing activities Financing Activities repayment of long-term debt Issuances of long term debt Long term debt repayment and issuance costs Issuances of common stock Repurchases of common stock Common stock dividends Net cash used for financing activities Net increase (decrease in cash and cash equivalents Cash and cash equivalents at beginning of year Cash and cash equivalents at end of year (413) (1,569) R.202) 11,000 0.2) (103) (175) 400 164 44 (1.310) (673) (482) (462) (405) (261) (1,791) (2,446) (2,076) 1,384 (230) (1,728) 780 1,010 2.738 $ 2,164 $ 780 $1,010 (a) Compute Lockheed Martin's current ratio and quick ratio for 2005 and 2004. (Round your answers to two decimal places.) 2005 current ratio = 0 2004 current ratio = 0 2005 quick ratio = O 2004 quick ratio = 0 x which of the following best describes the company's current ratio and quick ratio for 2005 and 2004 OThe current ratio has increased while the quick ratio has decreased in the period from 2004 to 2005, which suggests the company has a shortage of liquid assets. Both the current and quick ratios have decreased from 2004 to 2005. The company is fairly illiquid. Both the current and quick ratios have increased from 2004 to 2005. The company is fairly liquid OThe current ratio has decreased while the quick ratio has increased in the period from 2004 to 2005, which suggests the company has a shortage of current assets. (b) Compute total liabilities-to-equity ratios and total debt-to-equity ratios for 2005 and 2004. (Round your answers to two decimal places.) 2005 total liabilities-to-stockholders' equity = 0 x 2004 total liabilities to stockholders' equity = 0 2005 total debt-to-equity = 0 2004 total debt-to-equity= 0 (c) Compute times interest earned ratio, cash from operations to total debt ratio, and free operating cash flow to total debt ratios. (Round your answers to two decimal places.) 2005 times interest earned 0 2004 times interest earned = 0 2005 cash from operations to total debt o 2004 cash from operations to total debt = 0 2005 free operating cash flow to total debt = 0 2004 free operating cash flow to total debt = 0 Compute and interpret Liquidity, Solvency and Coverage Ratios Balance sheets and income statements for Lockheed Martin Corporation follow. Refer to these financial statements to answer the requirements. Income Statement Year Ended December 31 (In millions) 2005 2004 2003 Net sales Products $ 31,518 $30,202 $ 27,290 Service 5,695 5,324 4534 37,213 35,526 31,824 Cost of sales Products 27,882 27,637 25,306 Service 5,073 4,765 4,099 Unallocated coporate costs 803 914 443 33,758 33,316 29,848 3,455 2,210 1.976 Other Income (expenses), net (449) (121) 43 Operating profit 3,006 2,089 2,019 Interest expense 370 425 487 Earnings before taxes 2,636 1,664 1,532 Income tax expense 811 398 479 Net earnings $ 1,825 $1,266 $1,053 2005 2004 Balance Sheet December 31 (In millions) Assets Cash and cash equivalents Short-term investments Receivables Inventories Deferred income taxes Other current assets Total current assets Property, plant and equipment, net Investments in equity securities Goodwill Purchased intangibles, net Prepaid pension asset Other assets Total assets Liabilities and stockholders' equity Accounts payable Customer advances and amounts in excess of costs incurred Salaries, benefits and payroll taxes $ 2,164 $ 780 429 396 4,579 4,094 1,921 1,864 861 982 495 557 10,449 8,673 3,924 3,599 196 812 8,447 7,892 560 672 1,360 1,030 2,728 2,596 $ 27,664 $25,274 $1.998 4,331 1,475 $1,726 4,028 1,346 202 1,451 4,664 2,097 1.277 432 Liabilities and stockholders equity Accounts payable $ 998 $ 1,726 Customer advances and amounts in excess of costs incurred 4,331 4,028 Salaries, benefits and payroll taxes 1.4751 346 Current maturities of long-term debt Other current liabilities Total current liabilities 9,428 8,566 Long-term debt 5,264 Accrued pension liabilities 1,300 Other postretirement benefit liabilities 1,236 Other liabilities 2,331 1,887 Stockholders' equity Common stock, 51 par value per share 438 Additional paid-in capital 1,724 2.223 Retained earnings 7,278 5,915 Accumulated other comprehensive lo (1,553) (1,532) Other (14) (23) Total stockholders' equity 7,867 7021 Total liabilities and stockholders equity $ 27,664 $ 25,274 Consolidated Statement of Cash Flows Year Ended December 31 (in millions) 2005 2004 2003 Operating Activities Net earnings $ 1,825 $1,266 $1,053 Adjustments to reconcile net earnings to net cash provided by operating activities Depreciation and amortization 555511 480 Amortization of purchased intangibles 145 129 Deferred federal income tas 467 Changes in operating assets and liabilities: Receivables Inventories 519 (90 Accounts payable 288 330 Customer advances and amounts in excess of costs incurred 296 (228) (285) Other 534 568 (13) Net cash provided by operating activities 3.194 2,924 1,809 Investing Activities Expenditures for property, plant and equipment (865) (769) (687) Acquisition of business/investments in affiliated companies (84) (91) (821) Proceeds from divestiture of businesses/Investments in affiliated companies 935 279 234 Purchase of short-term investments, net (33) (156) (240) Other 28 53 Net cash used for investing activities (708) (1.461) (87 (259) (19 708) (1,461) Net cash used for investing activities Financing Activities repayment of long-term debt Issuances of long term debt Long term debt repayment and issuance costs Issuances of common stock Repurchases of common stock Common stock dividends Net cash used for financing activities Net increase (decrease in cash and cash equivalents Cash and cash equivalents at beginning of year Cash and cash equivalents at end of year (413) (1,569) R.202) 11,000 0.2) (103) (175) 400 164 44 (1.310) (673) (482) (462) (405) (261) (1,791) (2,446) (2,076) 1,384 (230) (1,728) 780 1,010 2.738 $ 2,164 $ 780 $1,010 (a) Compute Lockheed Martin's current ratio and quick ratio for 2005 and 2004. (Round your answers to two decimal places.) 2005 current ratio = 0 2004 current ratio = 0 2005 quick ratio = O 2004 quick ratio = 0 x which of the following best describes the company's current ratio and quick ratio for 2005 and 2004 OThe current ratio has increased while the quick ratio has decreased in the period from 2004 to 2005, which suggests the company has a shortage of liquid assets. Both the current and quick ratios have decreased from 2004 to 2005. The company is fairly illiquid. Both the current and quick ratios have increased from 2004 to 2005. The company is fairly liquid OThe current ratio has decreased while the quick ratio has increased in the period from 2004 to 2005, which suggests the company has a shortage of current assets. (b) Compute total liabilities-to-equity ratios and total debt-to-equity ratios for 2005 and 2004. (Round your answers to two decimal places.) 2005 total liabilities-to-stockholders' equity = 0 x 2004 total liabilities to stockholders' equity = 0 2005 total debt-to-equity = 0 2004 total debt-to-equity= 0 (c) Compute times interest earned ratio, cash from operations to total debt ratio, and free operating cash flow to total debt ratios. (Round your answers to two decimal places.) 2005 times interest earned 0 2004 times interest earned = 0 2005 cash from operations to total debt o 2004 cash from operations to total debt = 0 2005 free operating cash flow to total debt = 0 2004 free operating cash flow to total debt = 0