

Answered step by step
Verified Expert Solution
Question
1 Approved Answer
Compute the common-sized income statements for the past 3 years (2022, 2021, 2020) begin{tabular}{|c|c|c|c|} hline multicolumn{4}{|l|}{ Standardized Annual Balance Sheet } hline Report Date
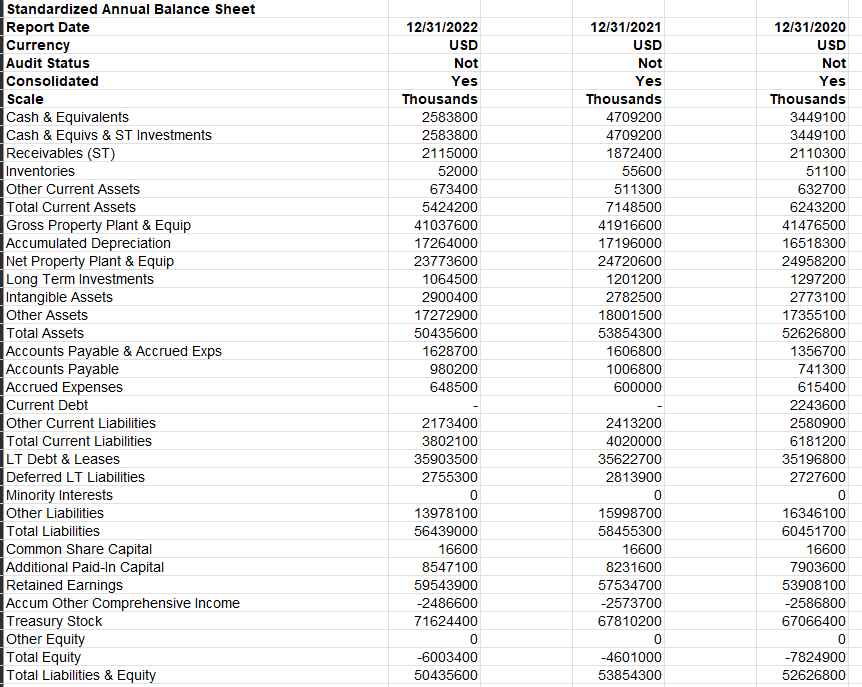
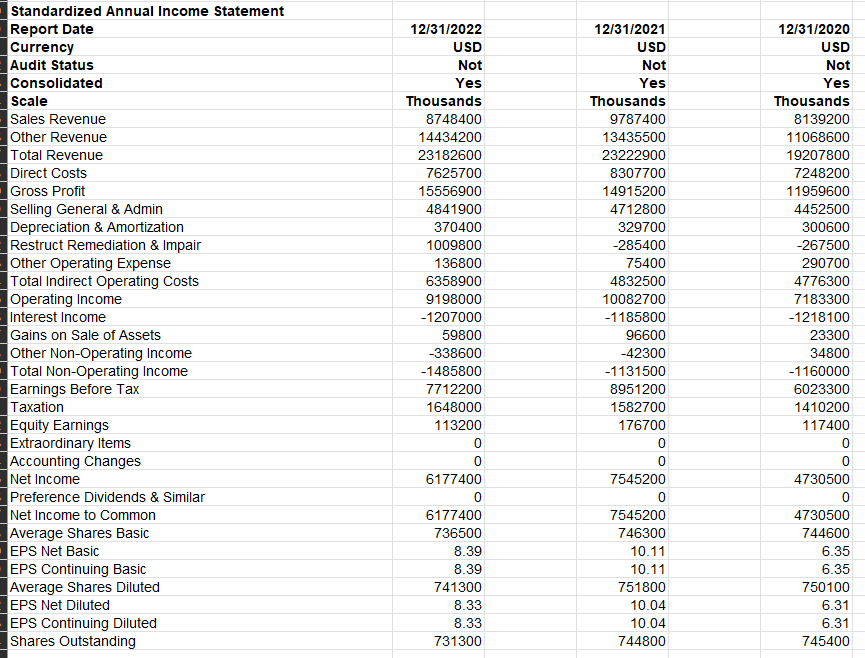
Compute the common-sized income statements for the past 3 years (2022, 2021, 2020)
\begin{tabular}{|c|c|c|c|} \hline \multicolumn{4}{|l|}{ Standardized Annual Balance Sheet } \\ \hline Report Date & 12/31/2022 & 12/31/2021 & 12/31/2020 \\ \hline Currency & USD & USD & USD \\ \hline Audit Status & Not & Not & Not \\ \hline Consolidated & Yes & Yes & Yes \\ \hline Scale & Thousands & Thousands & Thousands \\ \hline Cash \& Equivalents & 2583800 & 4709200 & 3449100 \\ \hline Cash \& Equivs \& ST Investments & 2583800 & 4709200 & 3449100 \\ \hline Receivables (ST) & 2115000 & 1872400 & 2110300 \\ \hline Inventories & 52000 & 55600 & 51100 \\ \hline Other Current Assets & 673400 & 511300 & 632700 \\ \hline Total Current Assets & 5424200 & 7148500 & 6243200 \\ \hline Gross Property Plant \& Equip & 41037600 & 41916600 & 41476500 \\ \hline Accumulated Depreciation & 17264000 & 17196000 & 16518300 \\ \hline Net Property Plant \& Equip & 23773600 & 24720600 & 24958200 \\ \hline Long Term Investments & 1064500 & 1201200 & 1297200 \\ \hline Intangible Assets & 2900400 & 2782500 & 2773100 \\ \hline Other Assets & 17272900 & 18001500 & 17355100 \\ \hline Total Assets & 50435600 & 53854300 & 52626800 \\ \hline Accounts Payable \& Accrued Exps & 1628700 & 1606800 & 1356700 \\ \hline Accounts Payable & 980200 & 1006800 & 741300 \\ \hline Accrued Expenses & 648500 & 600000 & 615400 \\ \hline Current Debt & - & - & 2243600 \\ \hline Other Current Liabilities & 2173400 & 2413200 & 2580900 \\ \hline Total Current Liabilities & 3802100 & 4020000 & 6181200 \\ \hline LT Debt \& Leases & 35903500 & 35622700 & 35196800 \\ \hline Deferred LT Liabilities & 2755300 & 2813900 & 2727600 \\ \hline Minority Interests & 0 & 0 & \\ \hline Other Liabilities & 13978100 & 15998700 & 16346100 \\ \hline Total Liabilities & 56439000 & 58455300 & 60451700 \\ \hline Common Share Capital & 16600 & 16600 & 16600 \\ \hline Additional Paid-In Capital & 8547100 & 8231600 & 7903600 \\ \hline Retained Earnings & 59543900 & 57534700 & 53908100 \\ \hline Accum Other Comprehensive Income & -2486600 & -2573700 & -2586800 \\ \hline Treasury Stock & 71624400 & 67810200 & 67066400 \\ \hline Other Equity & 0 & 0 & \\ \hline Total Equity & -6003400 & -4601000 & -7824900 \\ \hline Total Liabilities \& Equity & 50435600 & 53854300 & 52626800 \\ \hline \end{tabular} \begin{tabular}{|c|c|c|c|} \hline \\ \hline \multicolumn{4}{|c|}{\begin{tabular}{l} Standardized Annual Income Statement \\ Report Date \end{tabular}} \\ \hline Currency & USD & USD & USD \\ \hline Audit Status & Not & Not & Not \\ \hline Consolidated & Yes & Yes & Yes \\ \hline Scale & Thousands & Thousands & Thousands \\ \hline Sales Revenue & 8748400 & 9787400 & 8139200 \\ \hline Other Revenue & 14434200 & 13435500 & 11068600 \\ \hline Total Revenue & 23182600 & 23222900 & 19207800 \\ \hline Direct Costs & 7625700 & 8307700 & 7248200 \\ \hline Gross Profit & 15556900 & 14915200 & 11959600 \\ \hline Selling General \& Admin & 4841900 & 4712800 & 4452500 \\ \hline Depreciation \& Amortization & 370400 & 329700 & 300600 \\ \hline Restruct Remediation \& Impair & 1009800 & -285400 & -267500 \\ \hline Other Operating Expense & 136800 & 75400 & 290700 \\ \hline Total Indirect Operating costs & 6358900 & 4832500 & 4776300 \\ \hline Operating Income & 9198000 & 10082700 & 7183300 \\ \hline Interest Income & -1207000 & -1185800 & -1218100 \\ \hline Gains on Sale of Assets & 59800 & 96600 & 23300 \\ \hline Other Non-Operating Income & -338600 & -42300 & 34800 \\ \hline Total Non-Operating Income & -1485800 & -1131500 & -1160000 \\ \hline Earnings Before Tax & 7712200 & 8951200 & 6023300 \\ \hline Taxation & 1648000 & 1582700 & 1410200 \\ \hline Equity Earnings & 113200 & 176700 & 117400 \\ \hline Extraordinary Items & 0 & 0 & 0 \\ \hline Accounting Changes & 0 & 0 & 0 \\ \hline Net Income & 6177400 & 7545200 & 4730500 \\ \hline Preference Dividends \& Similar & 0 & 0 & 0 \\ \hline Net Income to Common & 6177400 & 7545200 & 4730500 \\ \hline Average Shares Basic & 736500 & 746300 & 744600 \\ \hline EPS Net Basic & 8.39 & 10.11 & 6.35 \\ \hline EPS Continuing Basic & 8.39 & 10.11 & 6.35 \\ \hline Average Shares Diluted & 741300 & 751800 & 750100 \\ \hline EPS Net Diluted & 8.33 & 10.04 & 6.31 \\ \hline EPS Continuing Diluted & 8.33 & 10.04 & 6.31 \\ \hline Shares Outstanding & 731300 & 744800 & 745400 \\ \hline \end{tabular}Step by Step Solution
There are 3 Steps involved in it
Step: 1

Get Instant Access to Expert-Tailored Solutions
See step-by-step solutions with expert insights and AI powered tools for academic success
Step: 2

Step: 3
Ace Your Homework with AI
Get the answers you need in no time with our AI-driven, step-by-step assistance
Get Started
Managerial Accounting
Authors: Peter C. Garrison, Ray H., Noreen, Eric W., Brewer
12th Edition
0071274227, 978-0071274227