Compute the following ratios for 2016 and 2015:
15) price earnings ratio
16) dividends per share
17) dividend yield
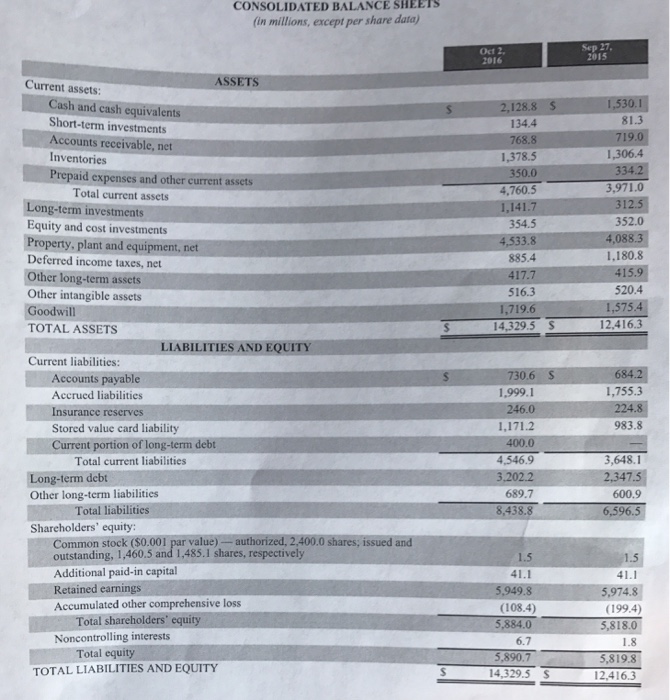
CONSOLIDATED BALANCE SHEETS (in millions, except per share data) ASSET Cument assets: Cash and cash equivalents Short-term investments Accounts receivable, net Inventories paid expenses and other current assets Total current assets Long-term investments Equity and cost investments Property, plant and equipment, net Deferred income taxes, net Other long-term assets Other intangible assets Goodwill TOTAL ASSETS LIABILITIES AND EQUITY Current liabilities: ccounts payable Accrued liabilities Insurance reserves Stored value card liability Current portion of long-term debt Total current liabilities Long-term debt Other long-term liabilities Total liabilities Shareholders' equity: mmon stock ($0.001 auth Additional paid-in capital Retained earnings Accumulated other comprehensive loss Total shareholders' equity Noncontrolling interests Total equity TOTAL LIABILITIES AND EQUITY Sep 27 2015 2016 2.128.8 s 81.3 134.4 719. 768.8 1,306.4 1,378.5 3,971.0 4,760.5 312.5 1,141.7 352.0 354.5 4.088.3 4,533.8 1.180.8 415.9 520.4 516.3 12,416.3 14,329.5 S 730.6 S 1,755.3 1,999.1 1,171.2 983.8 3,648. 4.546.9 8,438.8 6,596.5 1.5 41.1 41.1 5,974.8 (108.4) Cl99.4) 5,818.0 6.7 1.8 5.890,7 5,819.8 12,416.3 CONSOLIDATED BALANCE SHEETS (in millions, except per share data) ASSET Cument assets: Cash and cash equivalents Short-term investments Accounts receivable, net Inventories paid expenses and other current assets Total current assets Long-term investments Equity and cost investments Property, plant and equipment, net Deferred income taxes, net Other long-term assets Other intangible assets Goodwill TOTAL ASSETS LIABILITIES AND EQUITY Current liabilities: ccounts payable Accrued liabilities Insurance reserves Stored value card liability Current portion of long-term debt Total current liabilities Long-term debt Other long-term liabilities Total liabilities Shareholders' equity: mmon stock ($0.001 auth Additional paid-in capital Retained earnings Accumulated other comprehensive loss Total shareholders' equity Noncontrolling interests Total equity TOTAL LIABILITIES AND EQUITY Sep 27 2015 2016 2.128.8 s 81.3 134.4 719. 768.8 1,306.4 1,378.5 3,971.0 4,760.5 312.5 1,141.7 352.0 354.5 4.088.3 4,533.8 1.180.8 415.9 520.4 516.3 12,416.3 14,329.5 S 730.6 S 1,755.3 1,999.1 1,171.2 983.8 3,648. 4.546.9 8,438.8 6,596.5 1.5 41.1 41.1 5,974.8 (108.4) Cl99.4) 5,818.0 6.7 1.8 5.890,7 5,819.8 12,416.3


