Question
COMPUTER NETWORKS AND PROTOCOLS QUICK QUESTION ABOUT THROUGHPUT Why do you think we were not able to achieve a 100% application throughput (i.e., an application
COMPUTER NETWORKS AND PROTOCOLS
QUICK QUESTION ABOUT THROUGHPUT


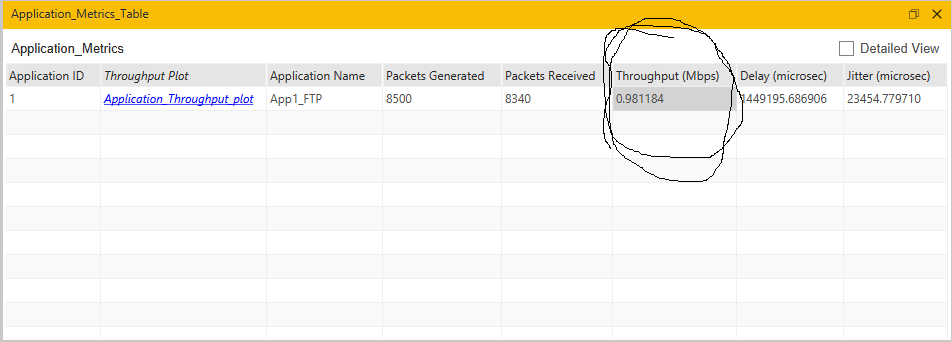
Why do you think we were not able to achieve a 100% application throughput (i.e., an application throughput of 1 Mbps), in spite of the fact the speed (nominal throughput) on the bottleneck link is exactly 1 Mbps? Where does this discrepancy (i.e., the loss in the theoretically possible application throughput) come from? Explain and provide a (simple) mathematical estimate/evaluation to support your explanation.
Hint 1: Right-click on Wired_Node_1, select Properties -> Transport_Layer. Observe that MSS(bytes), which represents the maximum amount of application-bytes placed in a single TCP/UDP packet, is 1460 bytes.
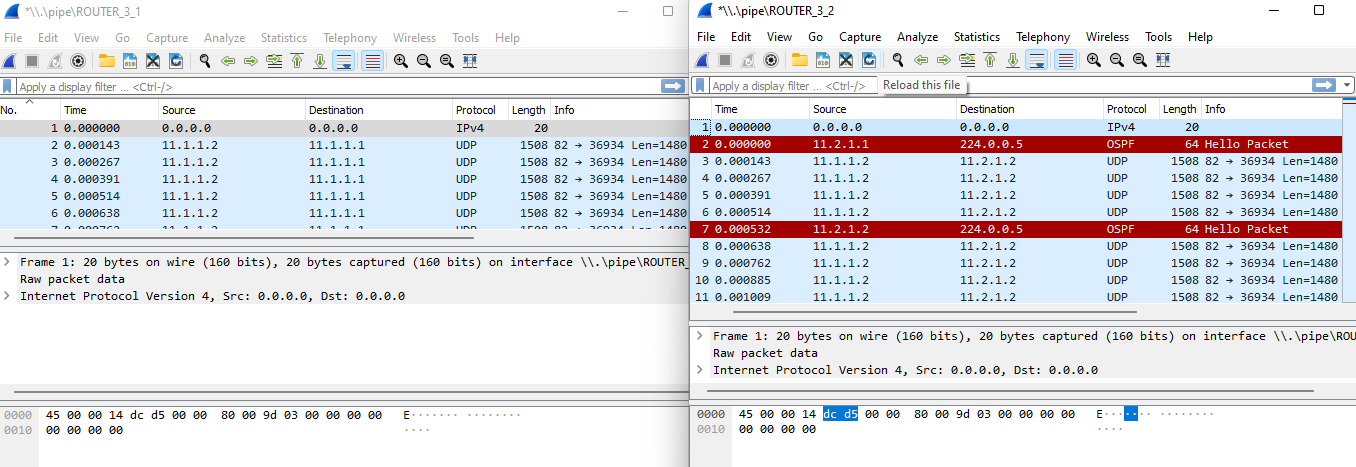
Hint 2: Examine the composition (payload + headers) of the actual UDP packets passing through Router_3 in the respective Wireshark capture.
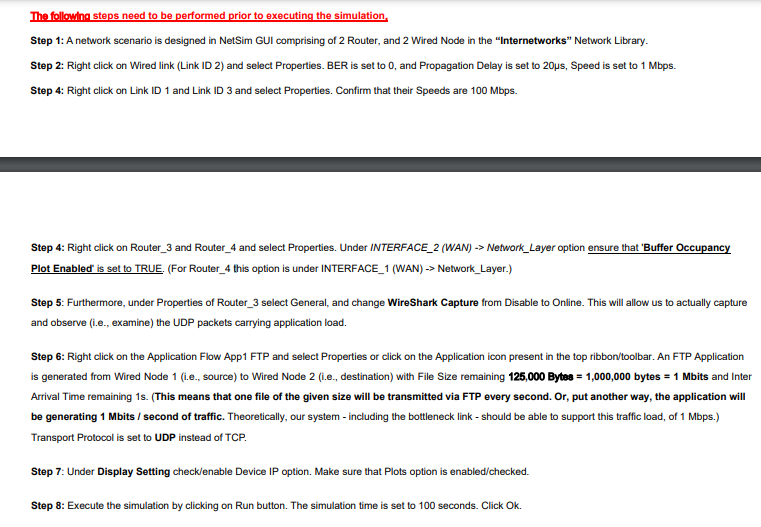
The followind steps need to be performed prior to executing the simulation. Step 1: A network scenario is designed in NetSim GUI comprising of 2 Router, and 2 Wired Node in the "Internetworks" Network Library. Step 2: Right click on Wired link (Link ID 2) and select Properties. BER is set to 0, and Propagation Delay is set to 20ps, Speed is set to 1 Mbps. Step 4: Right click on Link ID 1 and Link ID 3 and select Properties. Confirm that their Speeds are 100 Mbps. Step 4: Right click on Router_3 and Router_4 and select Properties. Under INTERFACE_2 (WAN) -> Network_Layer option ensure that 'Buffer Occupancy Plot Enabled is set to TRUE. (For Router_4 this option is under INTERFACE_1 (WAN) -> Network_Layer.) Step 5: Furthermore, under Properties of Router_3 select General, and change WireShark Capture from Disable to Online. This will allow us to actually capture and observe (i.e., examine) the UDP packets carrying application load. Step 6: Right click on the Application Flow App1 FTP and select Properties or click on the Application icon present in the top ribbon/toolbar. An FTP Application is generated from Wired Node 1 (i.e., source) to Wired Node 2 (i.e., destination) with File Size remaining 125,000 Bytes = 1,000,000 bytes = 1 Mbits and Inter Arrival Time remaining 1s. (This means that one file of the given size will be transmitted via FTP every second. Or, put another way, the application will be generating 1 Mbits / second of traffic. Theoretically, our system - including the bottleneck link - should be able to support this traffic load, of 1 Mbps.) Transport Protocol is set to UDP instead of TCP. Step 7: Under Display Setting check/enable Device IP option. Make sure that Plots option is enabled/checked. Step 8: Execute the simulation by clicking on Run button. The simulation time is set to 100 seconds. Click Ok. Application_Metrics_Table Application_Metrics Application ID 1 Application Throughput plot App1_FTP 8500 Packe 8340 MI.)pipelROUTER 3 1 I.IpipelROUTER_3_2
Step by Step Solution
There are 3 Steps involved in it
Step: 1

Get Instant Access to Expert-Tailored Solutions
See step-by-step solutions with expert insights and AI powered tools for academic success
Step: 2

Step: 3

Ace Your Homework with AI
Get the answers you need in no time with our AI-driven, step-by-step assistance
Get Started


