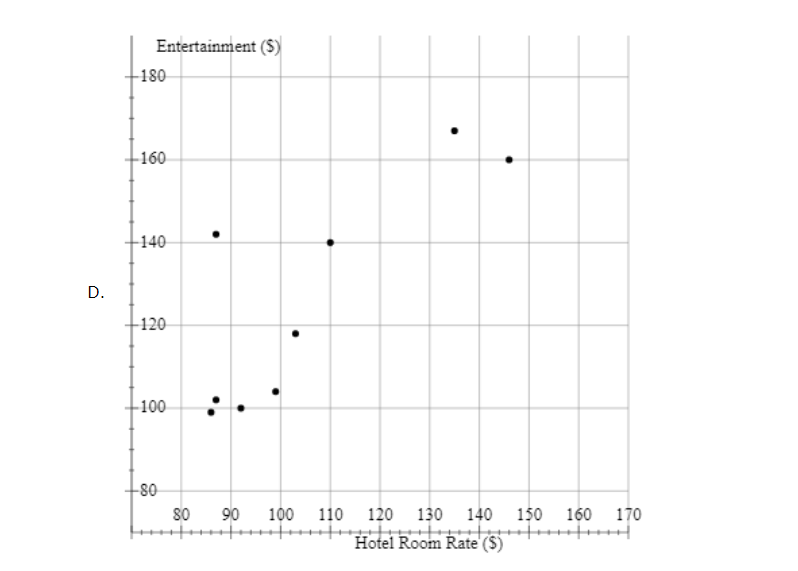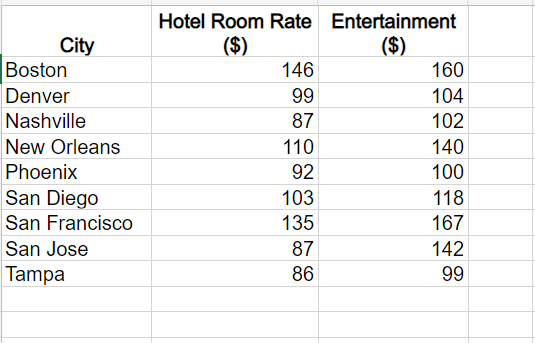


Concur Technologies, Inc., is a large expense-management company located in Redmond, Washington. The Wall Street Journal asked Concur to examine the data from 8.3 million expense reports to provide insights regarding business travel expenses. Their analysis of the data showed that New York was the most expensive city, with an average daily hotel room rate of $198 and an average amount spent on entertainment, including group meals and tickets for shows, sports, and other events, of $172. In comparison, the U.S. averages for these two categories were $89 for the room rate and $99 for entertainment. The table in the Excel Online file below shows the average daily hotel room rate and the amount spent on entertainment for a random sample of 9 of the 25 most visited U.S. cities (The Wall Street Journal, August 18 , 2011). Construct a spreadsheet to answer the following questions. \begin{tabular}{|l|r|r|} \hline \multicolumn{1}{|c|}{ City } & HotelRoomRate($) & \multicolumn{2}{|c|}{Entertainment($)} \\ \hline Boston & 146 & 160 \\ \hline Denver & 99 & 104 \\ \hline Nashville & 87 & 102 \\ \hline New Orleans & 110 & 140 \\ \hline Phoenix & 92 & 100 \\ \hline San Diego & 103 & 118 \\ \hline San Francisco & 135 & 167 \\ \hline San Jose & 87 & 142 \\ \hline Tampa & 86 & 99 \\ \hline \end{tabular} Concur Technologies, Inc., is a large expense-management company located in Redmond, Washington. The Wall Street Journal asked Concur to examine the data from 8.3 million expense reports to provide insights regarding business travel expenses. Their analysis of the data showed that New York was the most expensive city, with an average daily hotel room rate of $198 and an average amount spent on entertainment, including group meals and tickets for shows, sports, and other events, of $172. In comparison, the U.S. averages for these two categories were $89 for the room rate and $99 for entertainment. The table in the Excel Online file below shows the average daily hotel room rate and the amount spent on entertainment for a random sample of 9 of the 25 most visited U.S. cities (The Wall Street Journal, August 18 , 2011). Construct a spreadsheet to answer the following questions. \begin{tabular}{|l|r|r|} \hline \multicolumn{1}{|c|}{ City } & HotelRoomRate($) & \multicolumn{2}{|c|}{Entertainment($)} \\ \hline Boston & 146 & 160 \\ \hline Denver & 99 & 104 \\ \hline Nashville & 87 & 102 \\ \hline New Orleans & 110 & 140 \\ \hline Phoenix & 92 & 100 \\ \hline San Diego & 103 & 118 \\ \hline San Francisco & 135 & 167 \\ \hline San Jose & 87 & 142 \\ \hline Tampa & 86 & 99 \\ \hline \end{tabular}


