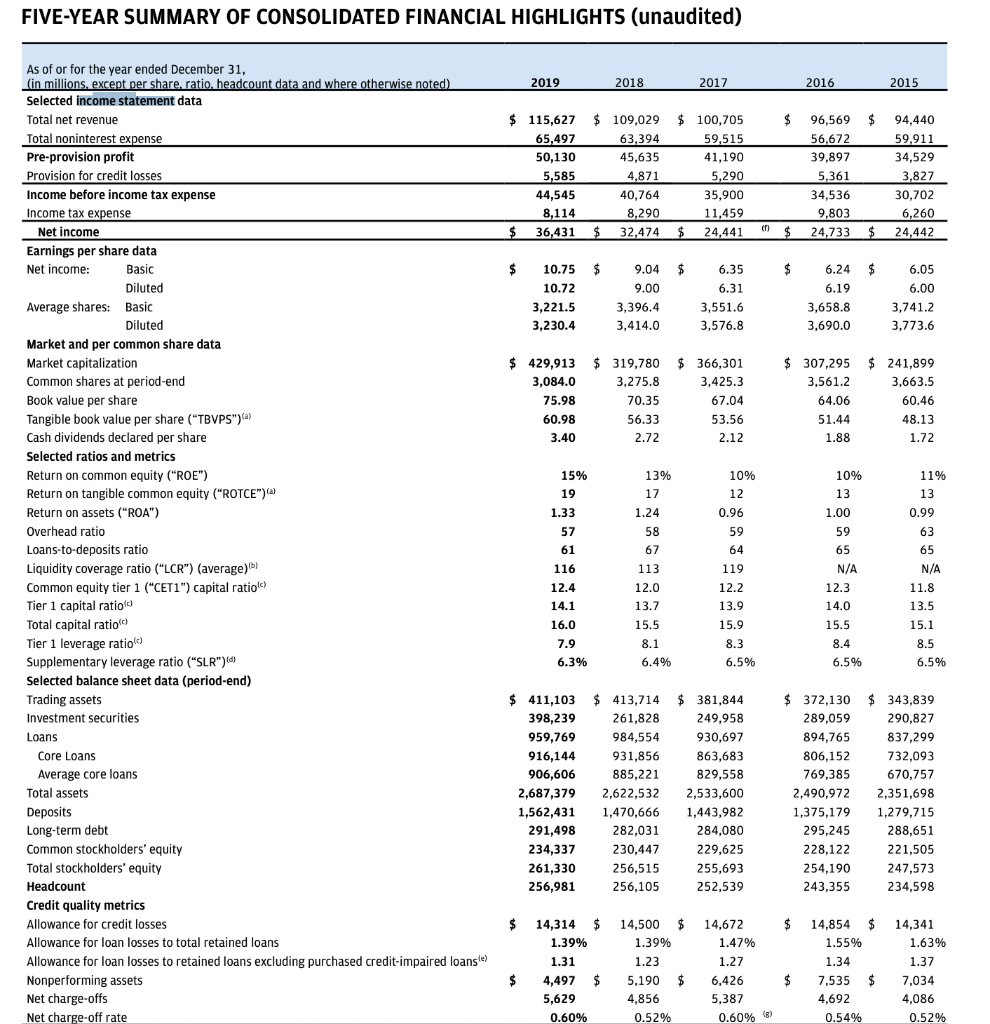
Conduct a balance sheet analysis and answer the following parts of this question:
a) Identify off-balance sheet exposure and identify impact to leverage and repayment.
b) Discuss access to a variety of capital markets segments to support business plan assumptions about need for growth capital.
c)Major changes in assets/liabilities
d) significant trends in liquidity, working capital and balance sheet ratios
e) Analysis by business segment

FIVE-YEAR SUMMARY OF CONSOLIDATED FINANCIAL HIGHLIGHTS (unaudited) 2019 2018 2017 2016 2015 $ $ $ 115,627 $ 109,029 65,497 63,394 50,130 45,635 5,585 4,871 44,545 40,764 8,114 8,290 $ 36,431 $ 32,474 $ 100,705 59,515 41,190 5,290 35,900 11,459 $ 24,441 96,569 56,672 39,897 5,361 34,536 9,803 24,733 94,440 59.911 34,529 3,827 30,702 6,260 24,442 (1) $ $ $ $ $ $ $ 10.75 10.72 3,221.5 3,230.4 9.04 9.00 3,396.4 3,414.0 6.35 6.31 3,551.6 3,576.8 6.24 6.19 3,658.8 3,690.0 6.05 6.00 3,741.2 3,773.6 $ 429,913 $319,780 $ 319,780 $ 366,301 3,084.0 3,275.8 3,425.3 75.98 70.35 67.04 60.98 56.33 53.56 3.40 2.72 2.12 $ 307,295 $ 241,899 3,561.2 3,663.5 64.06 60.46 51.44 48.13 1.88 1.72 13% 17 1.24 58 As of or for the year ended December 31, (in millions, except per share, ratio, headcount data and where otherwise noted) Selected income statement data Total net revenue Total noninterest expense Pre-provision profit Provision for credit losses Income before income tax expense Income tax expense Net income Earnings per share data Net income: Basic Diluted Average shares: Basic Diluted Market and per common share data Market capitalization Common shares at period-end Book value per share Tangible book value per share ("TBVPS")(a) Cash dividends declared per share Selected ratios and metrics Return on common equity ("ROE") Return on tangible common equity ("ROTCE") Return on assets ("ROA") Overhead ratio Loans-to-deposits ratio Liquidity coverage ratio ("LCR") (average)) Common equity tier 1 ("CET1") capital ratio) Tier 1 capital ratio) Total capital ratio Tier 1 leverage ratio) Supplementary leverage ratio ("SLR") Selected balance sheet data (period-end) Trading assets Investment securities Loans Core Loans Average core loans Total assets Deposits Long-term debt Common stockholders' equity Total stockholders' equity Headcount Credit quality metrics Allowance for credit losses Allowance for loan losses to total retained loans Allowance for loan losses to retained loans excluding purchased credit-impaired loanse) Nonperforming assets Net charge-offs Net charge-off rate 67 15% 19 1.33 57 61 116 12.4 14.1 16.0 7.9 6.3% 113 12.0 13.7 15.5 8.1 6.4% 10% 12 0.96 59 64 119 12.2 13.9 15.9 8.3 6.5% 10% 13 1.00 59 65 N/A 12.3 14.0 15.5 8.4 6.5% 11% 13 0.99 63 65 N/A 11.8 13.5 15.1 8.5 6.5% $ 411,103 $ 413,714 398,239 261,828 959,769 984,554 916,144 931,856 906,606 885,221 2,687,379 2,622,532 1,562,431 1,470,666 291,498 282,031 234,337 230,447 261,330 256,515 256,981 256,105 $ 381,844 249,958 930,697 863,683 829,558 2,533,600 1,443,982 284,080 229,625 255,693 252,539 $ 372,130 $ 343,839 289,059 290,827 894,765 837,299 806,152 732,093 769,385 670,757 2,490,972 2,351,698 1,375,179 1,279,715 295,245 288,651 228,122 221,505 254,190 247,573 243,355 234,598 $ $ $ 14,314 $ 14,500 $ 1.39% 1.39% 1.31 1.23 $ 4,497 $ 5,190 $ 5,629 4,856 0.60% 0.52% 14,672 1.47% 1.27 6,426 5,387 0.60% 14,854 1.55% 1.34 7.535 4,692 0.54% 14,341 1.63% 1.37 7,034 4,086 0.52% $ $ (8) FIVE-YEAR SUMMARY OF CONSOLIDATED FINANCIAL HIGHLIGHTS (unaudited) 2019 2018 2017 2016 2015 $ $ $ 115,627 $ 109,029 65,497 63,394 50,130 45,635 5,585 4,871 44,545 40,764 8,114 8,290 $ 36,431 $ 32,474 $ 100,705 59,515 41,190 5,290 35,900 11,459 $ 24,441 96,569 56,672 39,897 5,361 34,536 9,803 24,733 94,440 59.911 34,529 3,827 30,702 6,260 24,442 (1) $ $ $ $ $ $ $ 10.75 10.72 3,221.5 3,230.4 9.04 9.00 3,396.4 3,414.0 6.35 6.31 3,551.6 3,576.8 6.24 6.19 3,658.8 3,690.0 6.05 6.00 3,741.2 3,773.6 $ 429,913 $319,780 $ 319,780 $ 366,301 3,084.0 3,275.8 3,425.3 75.98 70.35 67.04 60.98 56.33 53.56 3.40 2.72 2.12 $ 307,295 $ 241,899 3,561.2 3,663.5 64.06 60.46 51.44 48.13 1.88 1.72 13% 17 1.24 58 As of or for the year ended December 31, (in millions, except per share, ratio, headcount data and where otherwise noted) Selected income statement data Total net revenue Total noninterest expense Pre-provision profit Provision for credit losses Income before income tax expense Income tax expense Net income Earnings per share data Net income: Basic Diluted Average shares: Basic Diluted Market and per common share data Market capitalization Common shares at period-end Book value per share Tangible book value per share ("TBVPS")(a) Cash dividends declared per share Selected ratios and metrics Return on common equity ("ROE") Return on tangible common equity ("ROTCE") Return on assets ("ROA") Overhead ratio Loans-to-deposits ratio Liquidity coverage ratio ("LCR") (average)) Common equity tier 1 ("CET1") capital ratio) Tier 1 capital ratio) Total capital ratio Tier 1 leverage ratio) Supplementary leverage ratio ("SLR") Selected balance sheet data (period-end) Trading assets Investment securities Loans Core Loans Average core loans Total assets Deposits Long-term debt Common stockholders' equity Total stockholders' equity Headcount Credit quality metrics Allowance for credit losses Allowance for loan losses to total retained loans Allowance for loan losses to retained loans excluding purchased credit-impaired loanse) Nonperforming assets Net charge-offs Net charge-off rate 67 15% 19 1.33 57 61 116 12.4 14.1 16.0 7.9 6.3% 113 12.0 13.7 15.5 8.1 6.4% 10% 12 0.96 59 64 119 12.2 13.9 15.9 8.3 6.5% 10% 13 1.00 59 65 N/A 12.3 14.0 15.5 8.4 6.5% 11% 13 0.99 63 65 N/A 11.8 13.5 15.1 8.5 6.5% $ 411,103 $ 413,714 398,239 261,828 959,769 984,554 916,144 931,856 906,606 885,221 2,687,379 2,622,532 1,562,431 1,470,666 291,498 282,031 234,337 230,447 261,330 256,515 256,981 256,105 $ 381,844 249,958 930,697 863,683 829,558 2,533,600 1,443,982 284,080 229,625 255,693 252,539 $ 372,130 $ 343,839 289,059 290,827 894,765 837,299 806,152 732,093 769,385 670,757 2,490,972 2,351,698 1,375,179 1,279,715 295,245 288,651 228,122 221,505 254,190 247,573 243,355 234,598 $ $ $ 14,314 $ 14,500 $ 1.39% 1.39% 1.31 1.23 $ 4,497 $ 5,190 $ 5,629 4,856 0.60% 0.52% 14,672 1.47% 1.27 6,426 5,387 0.60% 14,854 1.55% 1.34 7.535 4,692 0.54% 14,341 1.63% 1.37 7,034 4,086 0.52% $ $ (8)


