Answered step by step
Verified Expert Solution
Question
1 Approved Answer
Conduct a financial analysis using the Royal Bank Of Canada's annual report more balance sheet pictures Page 1: Introduce the company's most recent year, by
Conduct a financial analysis using the Royal Bank Of Canada's annual report 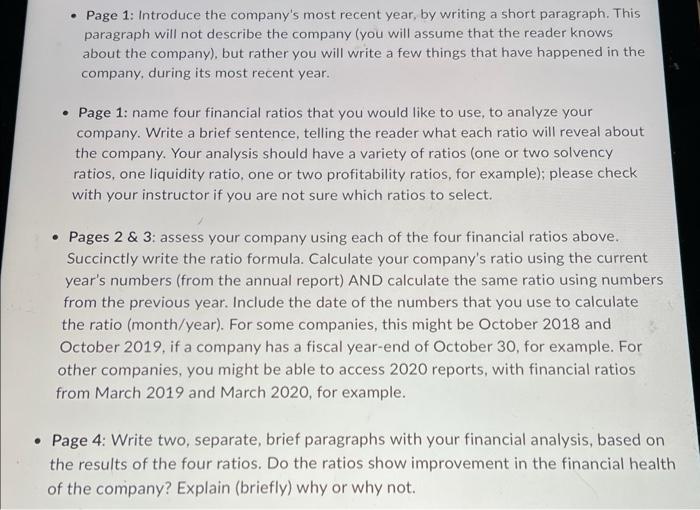

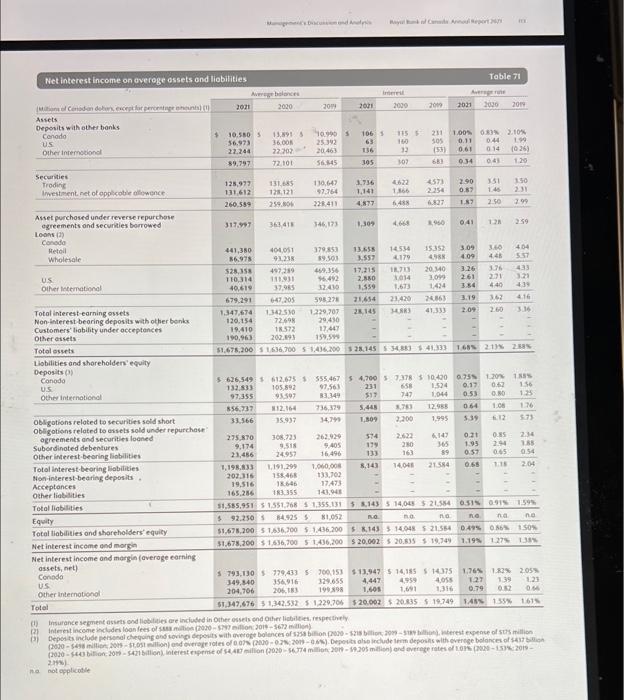
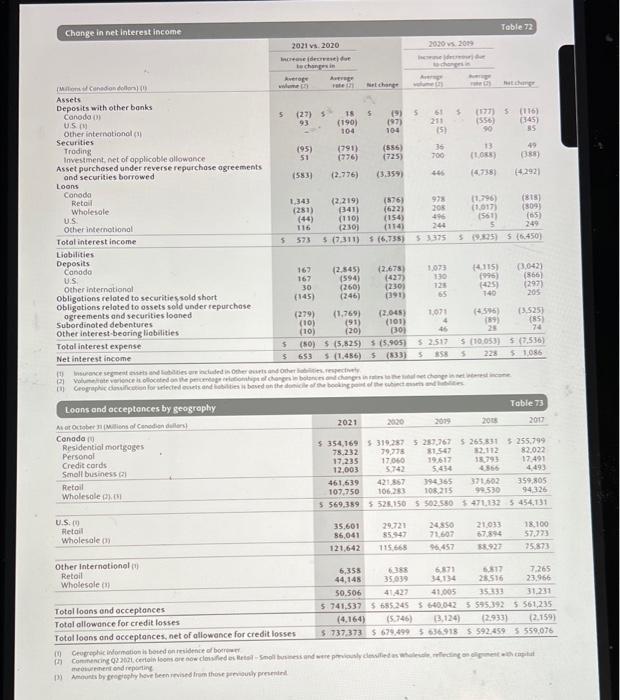
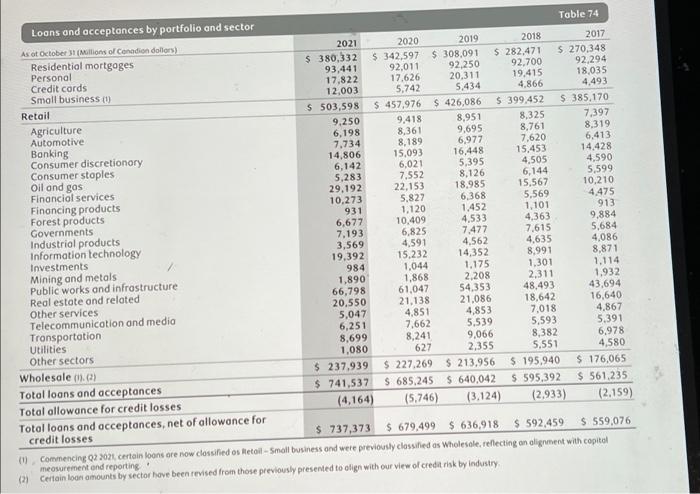
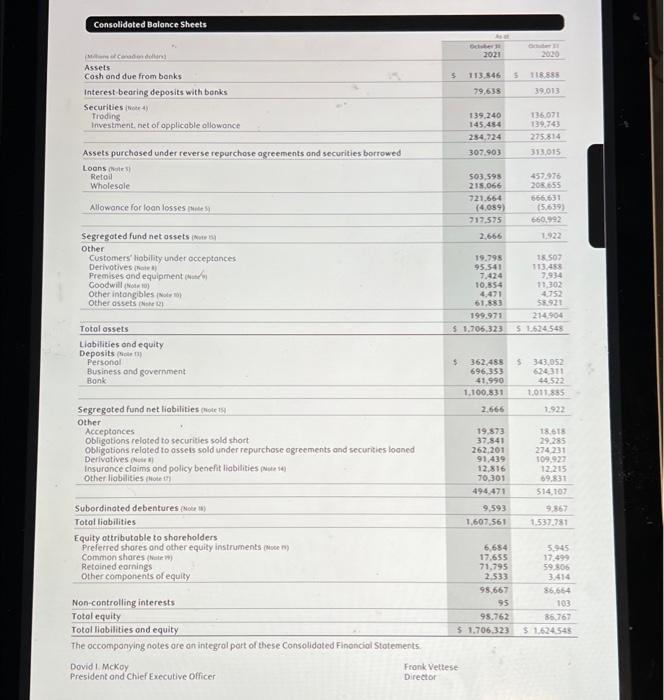
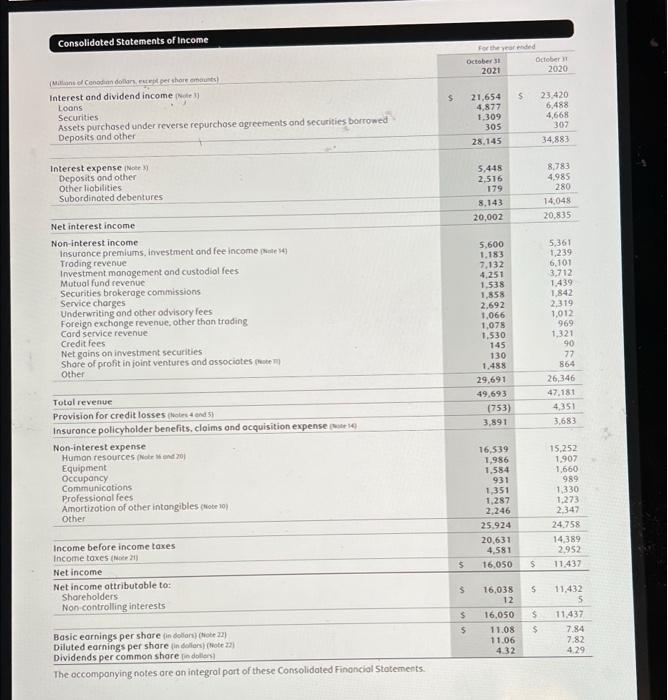
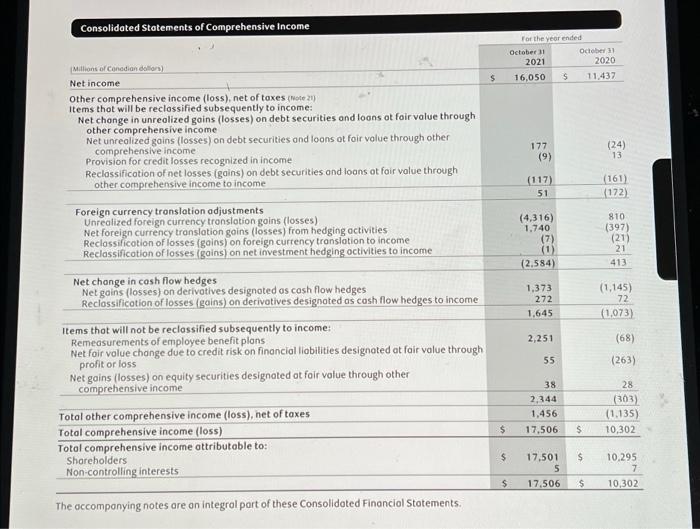
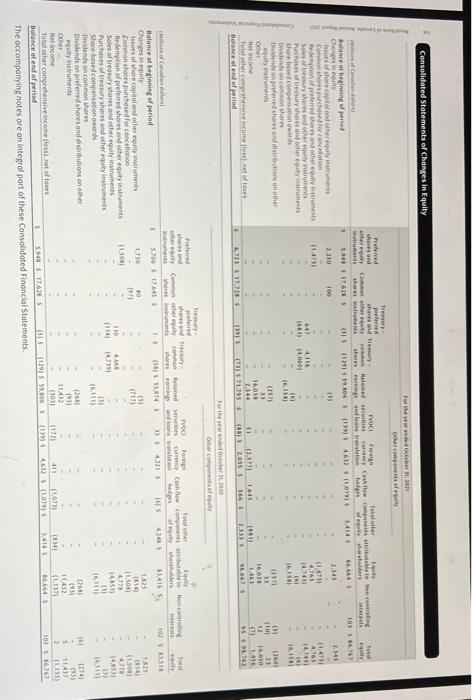
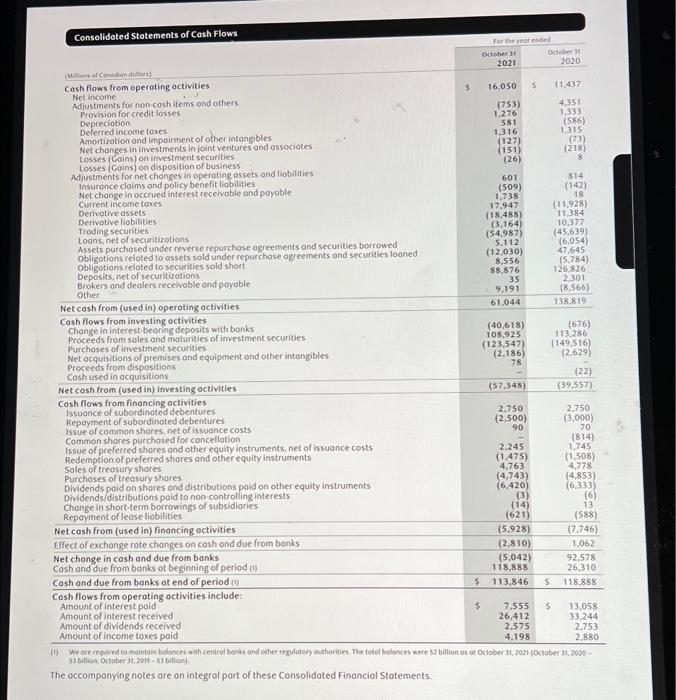
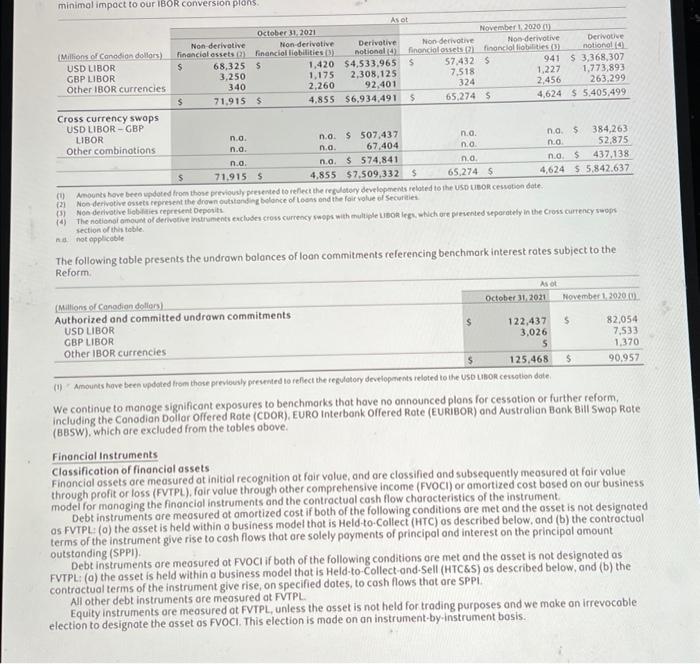
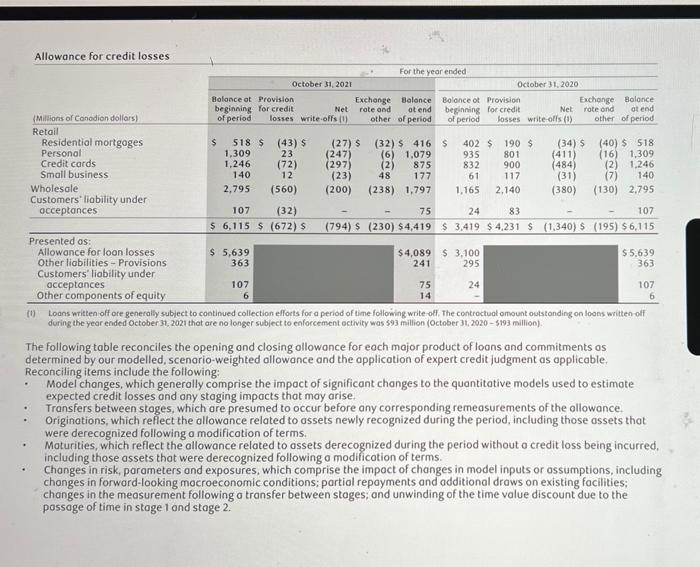
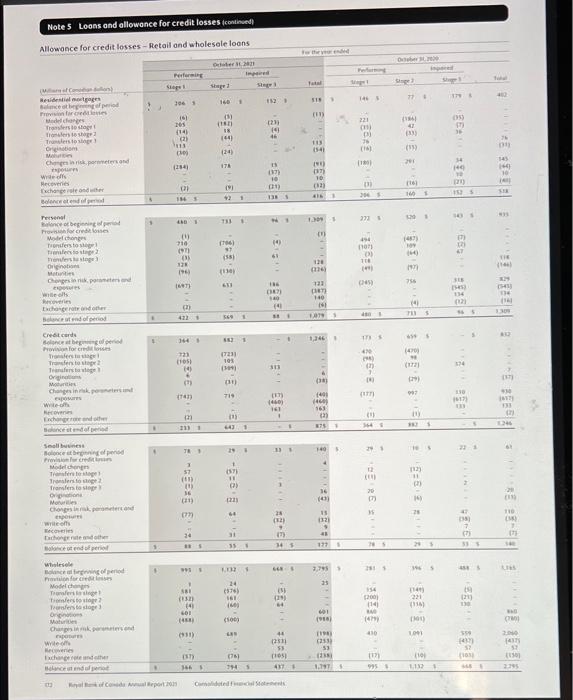
more balance sheet pictures 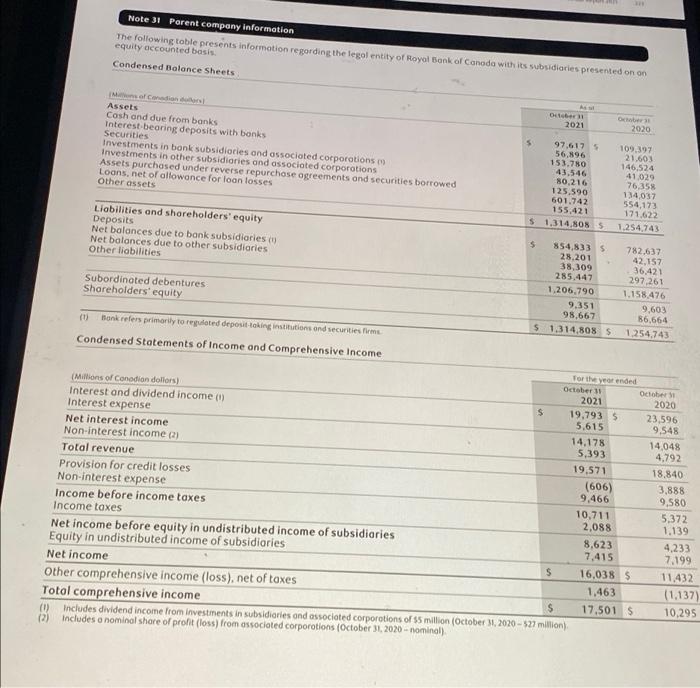
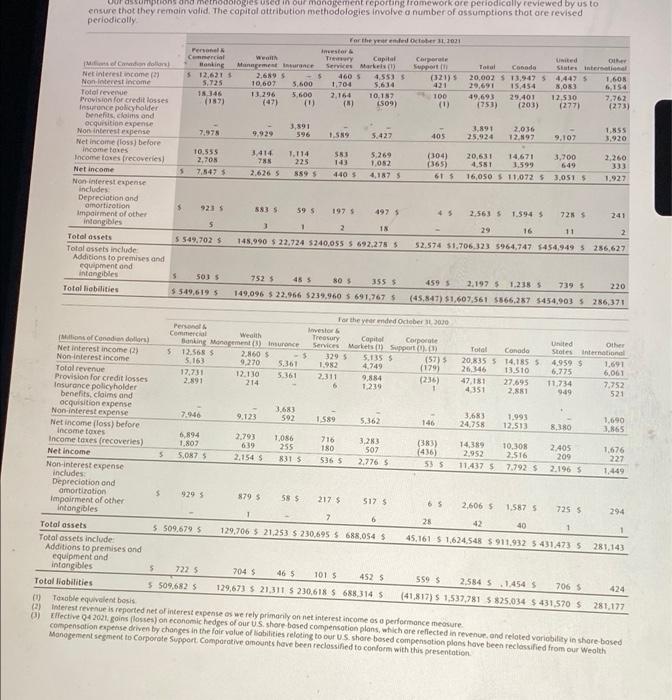
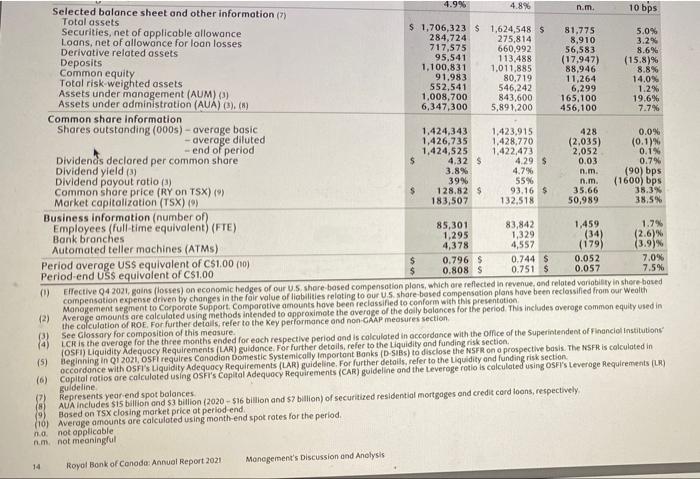
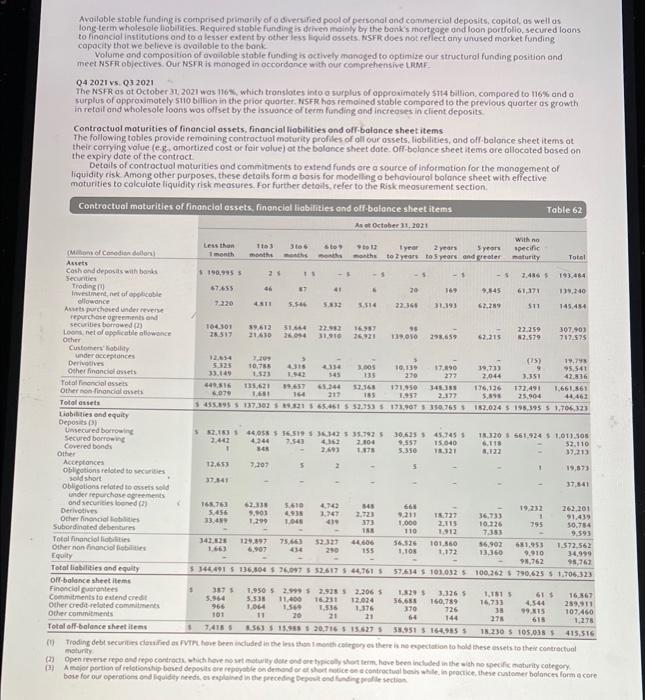
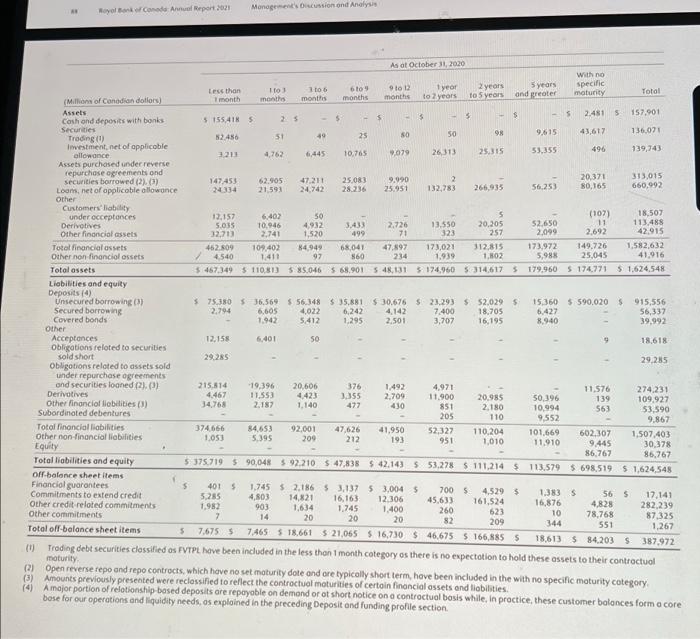
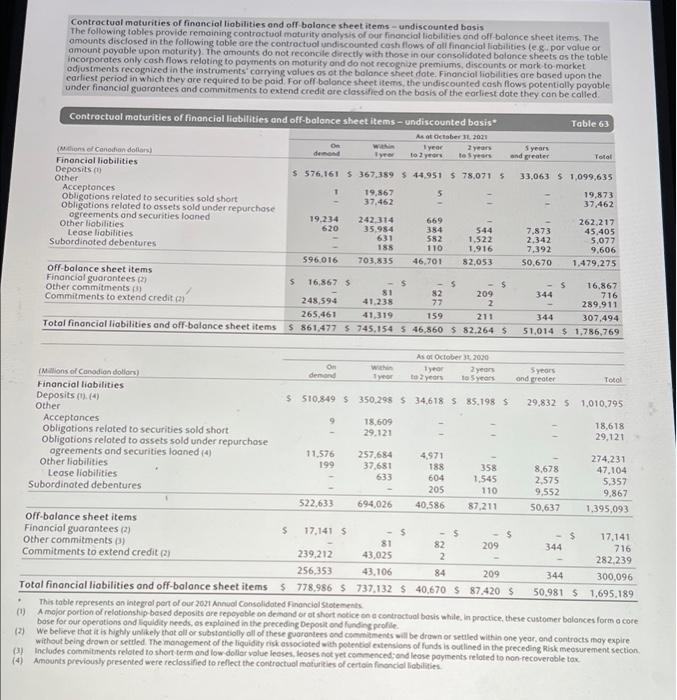
Page 1: Introduce the company's most recent year, by writing a short paragraph. This paragraph will not describe the company (you will assume that the reader knows about the company), but rather you will write a few things that have happened in the company, during its most recent year. Page 1: name four financial ratios that you would like to use, to analyze your company. Write a brief sentence, telling the reader what each ratio will reveal about the company. Your analysis should have a variety of ratios (one or two solvency ratios, one liquidity ratio, one or two profitability ratios, for example); please check with your instructor if you are not sure which ratios to select. Pages 2 & 3: assess your company using each of the four financial ratios above. Succinctly write the ratio formula. Calculate your company's ratio using the current year's numbers (from the annual report) AND calculate the same ratio using numbers from the previous year. Include the date of the numbers that you use to calculate the ratio (month/year). For some companies, this might be October 2018 and October 2019, if a company has a fiscal year-end of October 30, for example. For other companies, you might be able to access 2020 reports, with financial ratios from March 2019 and March 2020, for example. Page 4: Write two, separate, brief paragraphs with your financial analysis, based on the results of the four ratios. Do the ratios show improvement in the financial health of the company? Explain (briefly) why or why not. 1 long-term wholesale lobilities. Required stable funding is driven mainly by the bank's mortgage and loon portfolio secured loons Available stable funding is comprised primarily of o diversified pool or personal and commercial deposits.capitol, as well as to financial institutions and to a lesser extent by other less liquid assets. NSFR does not reflect any unused morket funding copacity that we believe is available to the bank Volume and composition of available stable funding is actively managed to optimize our structural funding position and meet NSFR objectives. Our NSFR is monaged in accordance with our comprehensive RMF 04 2021 vs. Q3 2021 The NSER os ot October 31, 2021 was 116 which translates into a surplus of approximately $114 billion, compared to 116% ondo surplus of opproximately sto billion in the prior quarter. NSFR has remained stable compared to the previous quarter os growth In retail and wholesale loons was offset by the issuance of term funding and increases in client deposits Contractual moturities of financial assets, financial liabilities and off balance sheet items The following tobles provide remaining contractual maturity profiles of oll our assets. liabilities, and off balance sheet items at their carrying value (eg, amortized cost or fair value) at the balance sheet dote Off-bolance sheet items are allocated based on the expiry date of the contract Details of contractual maturities ond commitments to extend funds are a source of information for the monagement of liquidity risk Among other purposes, these details for a basis for modelling a behavioural balance sheet with effective motunities to calculate liquidity risk measures. For further details, refer to the risk measurement section Contractual maturities of financial assets, financial liabilities and off-balance sheet items Table 62 As of October 31.2021 with no Less than 1103 3. sto tot Iyer 2 years years specific (Manel Comedian dollar months months to 2 years to 5 years and greater maturity Total Assets Cash and deposits with banka $199,9955 25 -5 -5 2.486 193.484 Securities Trading 67.655 46 6 20 169 9.545 Investment, et of applicable 61,171 139,240 allowance 431 5.54 5.832 5.314 22.366 1.193 62.289 511 145,454 Asus purchased under reverse purchase agreements and securities borrowed 104301 59,612 31.6 22.982 16 95 Loons net of applicable once 22.259 307.903 28317 21.610 26.014 31.910 26921 OSO 296659 Ocher 62.215 2.579 717.575 Customers' ability under acceptances 1265 5 (75) Derivatives 5.125 19.795 10.788 334 3.505 10,139 17.890 39.73) 9 95,541 Other Financial assets 1.535 LE 545 135 270 277 2.044 3.351 42.836 Total Financial assets 449,516 135,621 39.657 65.246 57.143 121.950 3-4.33 176,136 Other non financial 172.491 1,661 861 6,07 1.651 711 155 1.957 2.177 5.89 25.904 44.461 Total assets 55.895 $137.302 321 6461 $ 52.73 $ 171.907 350.765 152.024 5.195.1955 1.706,323 Liabilities and equity Deposits Unsecured borrowing $ 52.133440555 36.319 3647 5.35.792 5 30,63545.7455 Secured borrow 13.320 561.924 $ 1.01) SOS 2.442 4.244 7.54 2.104 9.557 15040 6.118 32.110 2.403 5.350 1321 8,122 37.213 12,653 7,207 5 1 19,873 Oblications related to secure sold short 37.541 obligations related to assets old 37.341 underrepurchase rements and securities booned 168.763 62338 5.610 4.10 661 Derivatives 19.252 5.456 9.90 4938 2.767 262,201 9.211 Other financials 15.727 36.733 1 91.439 33.49 1.299 104 373 1.000 2.115 Subordinated debentures 10.326 795 50.784 18 110 1.912 7.383 9.593 Total financiallibilities 342.21 129,99 75.44) 4606 563526 101.560 Other non financial Site 56.902 6.907 581.953 1.572,562 210 155 1.103 1.172 13.360 9.910 34999 Equity 91.762 95,762 Total liabilities and equity $ 344491 S 136.504 576097 5 52.617 5 44.1615 57.634 5 103.0325 100.262 $790.625 $ 1.706.323 Oll-balance sheet items Financial guarantees 1 387 1,950 $ 2.99 $ 2.933 5 2,206 S 1.8295 3.3265 Commitments to extend credit 1.151 5.564 5.338 16,367 11,400 16231 12.024 56.651 Other credit related commitment 160,789 16,733 4.544 966 1.064 1.536 1.376 289.911 370 726 35 Other commitments 101 99.115 11 20 107.450 144 275 615 1.276 Total off-balance sheet items 36 $ 15.555 $ 20,716 5 15.627 $35.951 3 164.95 13.230 5 105.0385 415,516 Trading debt securities couled VTPL been included in the stomach copy there is no expectation to hold these assets to the contractual maturity () Open reverserepe and repo control which have outdoor short term. have been included in the with specific mority category (2) Amejor portion of relationship based deposits are repoble on demandes contractul in practice these customer balonces forme core bose for our operations and liquidity needs splined in the preceding Deposit and founder section 315 overed bond Acceptances Royal Bank of Cand Annual Report 2021 Management's Discussion and Analysis As at October 31, 2020 with no Less than 2006 110 6109 90 1 year 5 years 2 years Specific (Millions of Canadian dollars) Total month months months months months and greater to 2 years maturity to 5 years Assets 25 5155.418 5 - 5 - 5 Cosh and deposits with bonis 3 3 $ 157.901 2.481 5 - 5 Securities Trading (1) 52.486 51 49 25 80 so 98 9,615 43,617 136071 Inwestment, net of applicable allowance 3.211 4,762 6,445 10,765 9079 26.313 25.315 53,355 496 139,743 Assets purchased under reverse repurchase agreements and securities borrowed (?). () 147,453 62.905 47211 25.083 9.990 2 20.371 313,015 Loans, net of applicable allowance 21.593 24.742 28.236 25.951 132,783 266,935 56.253 80,165 660,992 Other Customers' liability under acceptances 12.157 6,402 50 5 (107) 18,507 Derivatives 5.035 10.946 4,932 3.433 13.550 20,205 52.650 11 113.488 Other financial assets 32,713 2,741 1,520 499 71 323 257 2,099 2.692 42.915 Total Financial assets 462.909 109.402 84.949 68041 47.897 173,021 312,815 173,972 149.726 1.582.632 Other non-financial assets 4.540 1.411 97 360 234 1.939 1,802 5,988 25.045 41.916 Total assets $467.349 $ 110,813 385.046 $ 68,901 $ 48,131 3.174,960 3-314617 5 179,960 $ 174.771 $ 1.624,548 Liabilities and equity Deposits (4) Unsecured borrowing $75.380 $ 36,569 $ 56.348 $ 35,881 $30.676 $23.293 $ 52,029 $ Secured borrowing 15.360 5590.020 $ 915,556 2.704 6,605 4,022 6,242 4.142 7,400 18.705 6.427 56,337 Covered bonds 1.942 5.412 1.295 2.501 3,707 16,195 8,940 Other 39,992 Acceptances 12.155 6,401 50 9 Obligations related to securities 18.618 sold short 29.285 Obligations related to assets sold 29,285 under repurchase agreements and securities looned (2.0) 215.514 19,396 20,606 1.492 Derivatives 4.971 4.467 11.576 11,553 4.423 3.355 2.709 274.231 Other financial liabilities (3) 11.900 50.396 34.768 20.985 2.187 1.140 477 139 109,927 430 Subordinated debentures 851 2.180 10.994 563 53,590 205 110 9.552 Totol financial liabilities 9.867 374.666 84.653 92,001 Other non-financial liabilities 47,626 41.950 52,327 110.204 1.053 5.395 209 101.669 212 602,307 1.507.403 Equity 193 951 1,010 11.910 9.445 30,378 Total liabilities and equity 86,767 5375.7195 90,048 5 92.210 $ 47,838 S 42.143 553,278 $ 111,214 $ 86,767 off balance sheet items 113.579 5698,519 5 1,624,548 Financial guarantees 5 4015 Commitments to extend credit 1,745 $ 2.1865 3,137 53,004 S 5.255 700 5 4,803 14821 4,529 $ 1.3835 16,163 Other credit related commitments 565 12.306 45,633 1.982 17.141 161.524 903 1,634 1.745 16,876 1.400 Other commitments 4,828 282,239 260 7 20 20 623 10 78,768 20 82 87,325 Total off-balance sheet items 209 344 $ 7,675 57,465 $18.661 5 21,065 5 16,730 $ 46,675 5 166,885 S 1.267 Trading debt securities classified as PVTPL have been included in the less than 1 month category as there is no expectation to hold these assets to their contractual 18.613 $84.203 S 387,972 maturity (2) Open reverse repo and repo contracts, which have no set maturity date and are typically short term have been included in the with no specific maturity category (3) Amounts previously presented were reclassified to reflect the contractual maturities of certain financial assets and liabilities 14 A major portion of relationship based deposits are repayable on demand or ot short notice on a contractual bosis while, in practice, these customer balances forma core base for our operations and liquidity needs, os explained in the preceding Deposit and funding profile section 376 551 Contractual maturities of financial liabilities and off bolonce sheet items - undiscounted basis The following tobles provide remaining contractual maturity analysis of our financial liabilities and off balance sheet items. The amounts disclosed in the following toble are the contractual undiscounted cash flows of all financial liabilities les por value or amount payable upon maturity). The amounts do not reconcile directly with those in our consolidated balance sheets as the table incorporates only cash flows relating to payments on maturity and do not recognise premiums, discounts or mark to market adjustments recognized in the instruments carrying values as at the balance sheet date. Financial liabilities are based upon the earliest period in which they are required to be paid for off balonce sheet items the undiscounted cash flows potentially payable under financial guarantees and commitments to extend credit are classified on the basis of the earliest dote they con be called Contractual maturities of financial liabilities and off-balance sheet items - undiscounted basis Table 63 As et detaber 3 2021 year (Mahone Canadian dollars 2 years 5 years yrer to years and greater Total Financial liabilities Deposits $ 576,161 5367.389 $44.951 $ 78,071 S 33,063 5 1,099,635 Other Acceptances T 19,867 5 Obligations related to securities sold short 19.873 37.462 37,462 Obligations related to assets sold under repurchase ogreements and securities loaned 19,234 242.314 Other liabilities 262.217 620 35.984 384 544 Lease liabilities 7.873 45.405 631 582 1.522 2,342 5.077 Subordinated debentures 188 110 1.916 7.392 9.606 596.016 703.835 46,701 82,053 50,670 1,479,275 off-balance sheet items Financial guarantees (2) 5 16,867 $ $ 5 - $ 5 16,867 Commitments to extend credit car 81 82 209 344 716 248,594 41.238 77 2 289.911 265.461 41,319 159 211 344 307.494 Total financial liabilities and off-balance sheet items $ 861.477 5745,154 546,860 $ 82.264 5 51,014 $ 1,786,769 669 As October 31 2000 within year ( Mons of Canadian dollars) 2 years Syers demand to 2 years 10 years and greater Total Financial liabilities Deposits (1.4) $S10.849 $ 350,298 $ 34,618 5 85.1985 29,832 5 1,010,795 Other Acceptances 9 18,609 Obligations related to securities sold short 18,618 29.121 Obligations related to assets sold under repurchase 29.121 agreements and securities loaned (4) 11,576 257.684 4.971 274.231 Other liabilities 199 37.681 188 358 8,678 47,104 Lease liabilities 633 604 1.545 2.575 Subordinated debentures 5,357 205 110 9,552 9.867 522,633 694,026 40,586 87,211 50,637 1.395,093 off-balance sheet items Financial guarantees (2) $ 17,1415 $ - $ $ $ Other commitments) 17.141 81 82 209 344 716 Commitments to extend credit 2 239.212 43,025 2 282.239 256,353 43,106 84 209 344 300,096 Total financial liabilities and off-balance sheet items$ 778,986 $ 737,132 $ 40,670 $ 87,420 S 50.981 5 1.695.189 . This table represents an integral part of our 2071 Annual Consolidated Financial Statements (1) A major portion of relationship based deposits are repoyable on demand or ot short notice on contractual basis while, in practice these customer balonces forma core bose for our operations and liquidity needs, as explained in the preceding Deposit and funding profile (3) We believe that it is highly unlikely that all or substantially all of these guarantees and commitments will be drown of settled within one year, and contracts may expire without being drown or settled. The management of the liquidity risk associated with potential extensions of funds is outlined in the preceding Risk measurement section (3) Includes commitments related to short term and low dolor volueleases. Teoses not yet commenced and lease payments related to non-recoverable tox (4) Amounts previously presented were reclassified to reflect the contractual maturities of certain financial abilities 2011 30 150 Net interest income on average assets and liabilities Table 71 Averbalonces 2021 2020 200 2001 2000 200 2030 Assets Deposits with other banks Canada 30.500 5 13.95 0.99 1065 1155 211 us 1.000 2.10% 36.973 3600 25.392 63 305 0.11 0:44 199 Other international 22.244 220) 20:46) 136 12 (55) 0.61 014 10269 39,797 72.101 56545 395 07 680 0.34 0.41 1.20 Securities Trading 125,977 131.685 130,647 1.736 2.90 351 Investment.net of applicable lowonce 131.612 125.121 97764 1,141 1.366 2.254 0.87 260.589 28411 6485 6827 133 2.50 2.99 Asset purchased under reverse repurchase egreements and securities borrowed 317.99 363411 346.173 1,309 4.668 0:41 Loons Conado 441,350 404051 37033 13.6 1456 15352 3.09 3.60 404 Wholesale 36.975 123 39.501 3.559 4179 4 409 44 5:57 528,158 497289 469,356 17.215 17 US 20.540 326 176 110,314 111.931 2.550 1014 1.01 261 321 Other interational 40,619 37,0 124030 1.550 1,673 1404 35 4.40 679,291 647,205 593271 21654 23.420 2463 3.19 162 416 Total interest earning ossets 1.347.674 13:50 1.229,707 2.145 HERR 2.09 2.00 3.36 Non interest beoring deposits with other banks 120.154 72.698 Customers' liability under acceptances 29,450 19.410 16572 17:46 Other assets 190,963 202.193 159.59 Total assets 51.675,200 1636.700 5 1,436.00 $28.145 34 141333 16 21% 23 Libilities and shoreholders equity Deposits Conado 5626,549 $612.675 S 555.467 54,700 57378 $ 1.400 0.750 18 US 132.833 105.392 231 58 1.574 0.17 1.56 Other international 97.355 3507 33.149 517 747 1.044 053 0.86 1.25 856.737 112.164 736,329 5,445 12.955 064 1.08 116 Obligations related to securities sold short 33.366 35.937 34.79 1,809 2200 1.995 5.39 Obligations related to assets sold under repurchase agreements and securities loaned 275.870 308.723 262025 574 2623 14 0.21 0.85 2.34 Subordinated debentures 9,174 9.518 94405 179 20 305 1.95 294 15 Other interest-bearing liabilities 23,456 24.95 16.496 133 16 89 057 0.65 054 Total interest-bearing liabilities 1.198.833 L.191.299 1.060,000 8.14 14041 21584 0.65 2.04 Non interest-bearing deposits 202.316 158465 133.700 Acceptances 39,516 18645 17473 Other liabilities 165,286 183355 143.045 Total abilities 51.555.951 51.551.768 $ 1.355.1315 3.143 5 14,04 521584 0.5150911595 Equity $ 92,250 4.925$ 31.052 NO ma ma na Total liabilities and shareholders' equity $1.675.2005 1836.700 5 1,436,200 $ 143 1404 521554 0495 OS 10 Net interest income and margin 51.678.2005 1.636,700 1,436,200 $20,002 5 20.835 19.749 1.19% 127385 Net interest income and margin (average earning assets, nel) Conado $ 793.130 S 779,433 300.153 $13,947 5 141855175 1.76% 1 205 US 349,840 354,916 329.655 4,447 4959 4.055 1.27 139123 Other international 204.706 20613 1999 1.600 1.691 0.79 02 00 Total 51.347.676 5 1,342.532 5 1220,706 520.0025 20.335 5 19.749 145 155 1615 0 Insurance segmentets on bites are included in other uses on the respectively Interest income includes foon fees (2020-7201-562) Deposits include personal chequing and soin deposits with everage bolences of bio 0-521830-Wrest expense of smilion (2000-2005 - so will end average rates of 0720000201) Deports Include tem deposits with evergebleces of 12030-ci 2019-541 bilion interests of 14 million (2070-5674 million 01-10.305 moord vergetes - 2018 2. no not applicable 316 Table 72 Change in net interest income 2020 2019 2021 2020 Increased le chori Retail 200 49 Mi canadian doen www re Assets Deposits with other banks Canoda o 5 (27) 5 18 5 193 5 51 5 (177) 5 116) US 93 (190) (97) 211 1556) (345) Other international 100 104 15) 90 55 Securities Trading 195) 1791) (556) 35 49 Investment, net of applicable allowance 51 (776) (725) 700 (108) (388) Asset purchased under reverse repurchase agreements and securities borrowed (5833 (2.776) (3.359 (4.7381 (4.2921 Loons Conoda 1.343 (2.219) (576) 973 (1.796) (815) Wholesale (281) (341) (622) (1.017) (809) US (110) (154) 1561) (65) Other international 116 (2303 (114) 244 Total interest income 5 573 5 (7,311) $ 6,735) 53375 5995) 5 (6.450) Liabilities Deposits Canada 167 12.845) (2.678) 1073 4115) (3.042) US 167 (594) (427) 130 1095) (866) Other international 30 (260) 12303 (297) Obligations related to securities sold short (145) (246) (391) 140 205 obligations related to ossets sold under repurchase ogreements and securities looned (279) (2.045) (1.769) 1073 (456) (3.525 Subordinated debentures (10) (91) (101) 4 189 (85) Other interest-bearing liabilities (10) (20) (30 40 25 74 Total interest expense $ (50) 5 (5.825) 5 (5.905) 52.517S (10.053) $47.536) Net interest income $ 653 5 (1.486) 5 (833) 5 358 5 223 51086 ce standarde is Other and the We told the people get chance Geographic corected and beved the book Loons and acceptances by geography Table 73 An or October (in die doors 2021 2020 201 2017 Conada Residential mortgages $. 354.1695 319.2575 257.7675265331 5.255.799 Personal 75.232 79,778 31547 32.112 82.022 Credit cards 17.235 17660 19617 15791 17.491 Small business 12.003 314 5.434 4493 Retail 461 639 421857 394 365 371 502 359,805 Wholesale 107.750 10633 108.215 9950 94326 5 569,389 5.528.1505 502.5805471.1325 454.131 U.S. Retail 35,601 29.721 24350 21.033 18100 Wholesale 86.041 3547 71607 57.73 121.642 115.665 96.457 75.873 Other International Retail 6.153 63 6.871 5817 7.265 Wholesale 44,145 35.03 34134 2516 23.966 50.506 41429 41.00 35333 31.231 Total loons and acceptances 5.741.537 5655.245 $ 60,042 5 595.392 5.561,235 Totol allowance for credit losses (4.164) (5.746) 13,124) (2.933) (2.159 Totalloons and acceptances, net of allowance for credit losses 5/737.3735 679,4995636918 5 592.4595 559076 10 Geographic information is based on sidence of Com 22certain loons are now lesie Smollesanded that metod reporting D) Amounts by greeply how fired from the present Loons and acceptances by portfolio and sector Table 74 As ot October 31 Millions of Canadian dollars) 2021 2020 2019 2018 2017 Residential mortgages $ 380,332 $ 342,597 $ 308,091 $ 282,471 $ 270,348 Personal 93,441 92,011 92,250 92,700 92,294 Credit cards 17.822 17,626 20.311 19,415 18.035 Small business 12.003 5,742 5,434 4,866 4,493 Retail $ 503,598 $ 457,976 $426,086 $ 399,452 $ 385,170 Agriculture 9.250 9,418 8.951 8,325 7,397 Automotive 6,198 8,361 9,695 8,761 8,319 Banking 7,734 8,189 6,977 7.620 6,413 Consumer discretionary 14,806 15,093 16,448 15,453 14,428 Consumer stoples 6,142 6,021 5,395 4,505 4.590 Oil and gas 5.283 7.552 8,126 6,144 5,599 Financial services 29,192 22.153 18,985 15,567 10,210 Financing products 10,273 5,827 6,368 5,569 4.475 Forest products 931 1.120 1.452 1,101 913 Governments 6,677 10.409 4.533 4,363 9.884 Industrial products 7,193 6,825 7.477 7,615 5,684 Information technology 3,569 4,591 4,562 4,635 4,086 Investments 19,392 15.232 14,352 8,991 8,871 Mining and metals 984 1,044 1.175 1.301 1.114 Public works and infrastructure 1,890 1,868 2,208 2,311 1.932 Real estate and related 66,798 61,047 54,353 48,493 43,694 Other services 20.550 21.138 21.086 18,642 16,640 Telecommunication and media 5,047 4.851 4,853 7,018 4,867 Tronsportation 6,251 7,662 5.539 5.593 5.391 Utilities 8,699 8,241 9,066 8,382 6,978 Other sectors 1,080 627 2.355 5,551 4,580 Wholesale (1) $ 237,939 $ 227.269 $ 213,956 $ 195,940 $ 176,065 Total loans and acceptances $ 741.537 $ 685,245 $ 640,042 $ 595,392 $ 561.235 Total allowance for credit losses (4,164) (5.746) (3.124) (2.933) (2.159) Total loans and acceptances, net of allowance for credit losses $ 737,373 $ 679,499 $636,918 $ 592,459 $ 559,076 (0) Commencing 02 2021 certain loons are now classified os Retail - Small business and were previously classified as Wholesale, reflecting an alignment with capitol measurement and reporting (3) Certain loan amounts by sector have been revised from those previously presented to align with our view of credit risk by industry Consolidated Balance Sheets 2021 2020 Assets Cosh and due from banks 5 113.546 5 118888 Interest bearing deposits with banks 79,638 39.013 Securities (4) Trading 139.240 136.071 Investment, net of opplicable allowance 145.454 139,743 284,724 275.814 Assets purchased under reverse repurchase agreements and securities borrowed 307.903 313,015 Loans Retail 503,595 457.976 Wholesale 215.066 200 655 721.664 666.631 Allowance for loan losses (4.089 15.6391 717.575 6604792 Segregated fund net assets 2.666 1922 Other Customers' lobility under acceptances 19.795 15.507 Derivatives 95.541 113.455 Premises and equipment 7.424 7,934 Goodwill (10) 10,854 11.302 Other intangibles No 4.471 4752 Other assets 61.833 5821 199.971 214904 Total assets $ 1.705 323 5 1624 545 Liabilities and equity Deposits Personal $ 362485 $343.052 Business and government 696,353 624311 Bank 41.990 44.522 1.100.831 1,011.895 Segregated fund net liabilities (Note 18 2.666 1.922 Other Acceptances 19.873 18.618 Obligations related to securities sold short 37.841 29.285 Obligations related to osseis sold under repurchase agreements and securities looned 262,201 274 231 Derivatives 91.439 109.922 Insurance claims ond policy benefit liabilities (4) 12.816 12215 Other liabilities the 10.301 69.831 494.471 514,102 Subordinated debentures (Note) 9,593 9,567 Total liabilities 1.607,561 1.537,781 Equity attributable to shareholders Preferred shores and other equity instruments 6.684 5.945 Common shares (New 17.655 17.499 Retoined earnings 71.795 59 506 Other components of equity 2.533 3.414 95.667 86,654 Non-controlling interests 95 103 Total equity 95,762 36.767 Total liabilities ond equity 5 1.706,323 $ 1624 545 The accompanying notes are an integral part of these Consolidated Financial Statements David Mckoy Frank Vettese President and Chief Executive Officer Director Consolidated Statements of income For the yearned October October 2021 2020 $ $ (Man of Canadian dollar per shore counts Interest and dividend income (de) Loans Securities Assets purchased under reverse repurchase agreements and securities borrowed Deposits and other 23.420 6.488 4,668 21.654 4.877 1.309 305 28.145 302 34.883 Interest expense Deposits and other Other liabilities Subordinated debentures 5,445 2,516 179 8.783 4.985 280 14.048 20,835 8.143 20,002 Net interest income Non-interest income Insurance premiums, investment and fee income (4) Trading revenue Investment management and custodiol fees Mutual fund revenue Securities brokerage commissions Service charges Underwriting and other odvisory fees Foreign exchange revenue, other than trading Card service revenue Credit fees Net gains on investment securities Share of profit in joint ventures and associates Other 5,600 1.183 7.132 4.251 1.538 1.858 2,692 1.066 1,078 1.530 145 130 1.488 29.691 49,693 (753) 3.891 5,361 1239 6.101 3.712 1.439 1.842 2,319 1,012 969 1.321 90 72 864 26,346 47.181 4,351 3,683 Total revenue Provision for credit losses and Insurance policyholder benefits. claims and acquisition expense Non-interest expense Humon resources (Noe and 70 Equipment Occupancy Communications Professional fees Amortization of other intongibles (tote 10) Other 16,539 1,986 1.584 931 1.351 1.287 2.246 25.924 20.631 4,581 16.050 15,252 1.907 1,660 989 1.330 1.273 2.347 24.758 14,389 2.952 11.437 5 $ Income before income taxes Income taxes (N) Net Income Net income attributable to: Shareholders Non controlling interests $ $ $ 16,038 12 16.050 11.08 11.06 4.32 $ $ 11.432 5 11.437 7.84 7.82 4.29 $ Basic earnings per shore indoor) (hoe 22) Diluted earnings per share info) (hote 22 Dividends per common shore in dollars The accompanying notes are on integral part of these Consolidated Financial Statements Consolidated Statements of Comprehensive Income For the year ended October 31 October 2021 2020 16,050 $ 11.437 $ 177 (9) (24) 13 Millions of Canadian dollars) Net income Other comprehensive income (loss), net of taxes (Note 20 items that will be reclassified subsequently to income: Net change in unrealized gains (losses) on debt securities and loans ot fair value through other comprehensive income Net unrealized gains (losses) on debt securities and loons ot foir value through other comprehensive income Provision for credit losses recognized in income Reclassification of net losses (gains) on debt securities and loons ot fair value through other comprehensive income to income Foreign currency translation adjustments Unrealized foreign currency translation goins (losses) Net foreign currency translation goins (losses) from hedging activities Reclassification of losses (gains) on foreign currency translation to income Reclassification of losses (gains) on net investment hedging activities to income (117) (161) (172) 51 (4,316) 1.740 (7) 810 (397) (21) 21 413 (2,584) 1,373 272 1,645 Net change in cash flow hedges Net gains (losses) on derivatives designated as cash flow hedges Reclassification of losses (gains) on derivatives designated as cash flow hedges to income Items that will not be reclassified subsequently to income: Remeasurements of employee benefit plons Net foir volue change due to credit risk on financial liabilities designated at fair value through profit or loss Net gains (losses) on equity securities designated at for value through other comprehensive income (1,145) 72 (1.073) (68) (263) 2,251 55 38 2,344 1.456 17,506 28 (303) (1.135) 10,302 $ $ Total other comprehensive income (loss), net of taxes Total comprehensive income (loss) Totol comprehensive income attributable to: Shareholders Non-controlling interests $ $ 17,501 5 17,506 10,295 7 10,302 $ S The accompanying notes are an integral part of these Consolidated Financial Statements. Consolidated Statements of Changes in Equity For the next cowy Petewed pe chores and shares and her FOCI w Te were there were My Chelsea thwest shirts wythurtha terus 5.345 176 * 12 59.404 14612 1 (1.01) 3:4145 666 101 156.767 100 1.15 441 41 (40103 Belance et beginning of pried COM the contri in Churchforce winners and other county Shend other equity inimene Premur honderden Sheboued content wards Didenden.com Dividendenred her on the wystments O Aretince Toch income out) Bolsce standard (1.474 765 14433 16.15 1.4151 4163 144 461 (2531 33 16.01 2166 2171795 3 16 1.463 567 ci (10) (10 21 11 160 0 1.455 95.161 81 (S20355 (1811 3:31 6733 817,711 when One come TRY Preved hond whered try wo org they con cornede Conho como ha TO hommand can be des Balance of beginning of period 506 $12.645 (55) 555514 33 4.21 424 Changes Issues of recopil and other equituments 30 (5) 25 1. Common shares purchased for concellation 1973 07 (814 16 Redemption of preferred shores ond other equityistents 11.500 11.SON (10) Sales of treasury shoes and other equity instruments 10 48 Purchases of truy shares and other equity intents (485) Shore based comparison words 02 Dividends on common shoes 16110 10.111 Dividends on preferred shores and distributions on the uity instruments 0261 2011 16 1274 Other 193) 1933 Net income 11412 1492 5 MAT Toto other combensive income foss), netos (03 411 (10 L. 1.135 Balance at end of period 5 5.-48 5 17,615 (139) S. 1393 4,612 SILOS 3414 45 1013 36.767 The accompanying notes are on Integral part of these Consolidated Financial Statements. 103 1.333 Consolidated Statements of Cash Flows For the year October 31 Odobes 2021 2020 of Canadian dollar Cosh flows from operating activities $ 16,050 3 11.437 Net Income Adjustments for non-cosh items and others (753) 4,351 Provision for credit losses Depreciation 1,276 581 (586) Amortization and impairment of other intangibles 1,316 1.315 Net changes in investments in joint ventures and associates (127) (73) Losses (Gains) on investment Securities (151) (218) Losses (Goins) on disposition of business (26) Adjustments for net changes in operating ossets and liabilities Insurance claims and policy benefit libilities 601 814 Net change in occrued interest receivable and payable (509) (142) Current income taxes 1.738 18 Derivative assets 17,947 (11.928) Derivative liabilities (18,488) 11,384 Trading securities (3,164) 10,377 Loons, net of securitizations (54,987) (45,639) Assets purchased under reverse repurchase agreements and securities borrowed 5.112 (6,054 Obligations related to assets sold under repurchase agreements and securities looned (12.030) 47,645 Obligations related to securities sold short 8.556 (5,784) Deposits, net of securitizations 88,876 126,826 Brokers and dealers receivable and payable 35 2.301 Other 9.191 (8,566) Net cash from (used in) operating activities 61.044 138,819 Cash flows from investing activities Change in interest beoring deposits with bonks (40.618) (676) Proceeds from soles and maturities of investment securities 108.925 113.286 Purchases of investment securities (123,547) (149.516) Net ocquisitions of premises and equipment and other intongibles (2.186 12,629) Proceeds from dispositions 78 Cosh used in acquisitions (22) Net cash from (used in) Investing activities (57,345) (39.557) Cosh flows from financing octivities Issuance of subordinated debentures 2,750 2.750 Repayment of subordinated debentures Issue of common shores, net of issuance costs (2,500) (3,000 90 70 Common shares purchased for concellotion (814) Issue of preferred shores and other equity instruments, net of issuance costs 2.245 1,745 Redemption of preferred shores and other equity instruments (1.475) (1.508) Sales of treasury shores 4.763 4,778 Purchases of treasury shores Dividends paid on shores ond distributions paid on other equity Instruments (4.743) 14.853) (6,420) Dividends/distributions paid to non-controlling interests (6,333) (3) (6) Change in short-term borrowings of subsidiaries (14) 13 Repayment of lease liabilities (621) (588) Net cash from (used in) financing activities (5.928) (7.746) Effect of exchange rate changes on cash and due from banks (2.810) 1,062 Net change in cash and due from banks Cash and due from banks ot beginning of periode (5,042) 92.578 118,888 26,310 Cash and due from banks ot end of period (1) $ 113,846 S 118.888 Cosh flows from operating activities include: Amount of interest paid 5 Amount of interest received 7.555 s 13.058 Amount of dividends received 26,412 33,244 Amount of income taxes paid 2.575 2,753 4.198 2.880 0 We are required to maintain bolonces with central banks on other regulatory thorities. The lotol bolonces were $2 billions of October 31, 2011 October 1, 2020 3.3 billion October 31, 2019-51 billion) The accompanying notes are an integral part of these Consolidated Financial Statements. minimal impact to our IBOR conversion plons Asot October 31, 2021 November 2010/0 Non derivative Non-derivative Derivative Non derivative Non derivative Derivative Millions of Canodion dollars) financial assets Financial liabilities (0) notional financial assets financiallibilities notional USD LIBOR $ 68,325 5 1,420 $4,533.965 S 57.4325 941 $ 3,368,307 GBP LIBOR 3,250 1,175 2.308,125 7.518 1,227 1,773,893 Other IBOR currencies 340 2,260 92,401 324 2,456 263,299 $ 71,915 $ 4,855 $6.934,491 5 65,274 5 4,624 $ 5.405,499 Cross currency swops USD LIBOR-GBP LIBOR no no $ 507,437 no na 5 384,263 Other combinations n.o. no 67,404 na no 52.875 no no $ 574,841 no no $ 437,138 71.915 $ 4,855 $7,509,332 $ 65.274 5 4,624 55,842.637 (0) Amounts have been updated from those previously presented to reflect the regulatory developments related to the USD UBOR cessation date 121 Non derivativesses represent the crown outstanding blonce of loans on the fair value of Securities (5) Non derivative libises cepresent Deposit 14) The notional amount o derivative Instruments excludes cross currency ops with multiple UIBOR wich are presented separately in the cross currency Swops section of this table o not applicable The following table presents the undrawn balances of loan commitments referencing benchmark interest rates subject to the Reform Asot (Millions of Conodion dollars October 11, 2021 November 1, 20200 Authorized and committed undrown commitments USD LIBOR $ 122,437 $ 82,054 GBP LIBOR 3.026 7,533 Other IBOR currencies 5 1.370 125,468 $ 90.957 (1) Amounts have been updated from those previously presented to reflect the regulatory developments related to the USD UIBOR cessation date We continue to manoge significant exposures to benchmarks that have no onnounced plans for cessation or further reform, including the Conodian Dollar offered Rote (CDOR), EURO Interbank Offered Rote (EURIBOR) and Australian Bank Bill Swop Rate (BBSW), which are excluded from the tobles obove. Financial Instruments Classification of financial assets Financial assets are measured at initial recognition ot fair volue, and are clossified and subsequently measured at foir volue through profit or loss (FVTPL), fair value through other comprehensive income (FVOCI) or amortixed cost based on our business model for monoging the financial instruments and the contractual cash flow characteristics of the instrument Debt instruments are measured ot amortized cost if both of the following conditions are met and the asset is not designated as FVTPL: (O) the asset is held within a business model thot is Held-to-Collect (HTC) os described below, and (b) the controctual terms of the instrument give rise to cash flows that are solely payments of principal and interest on the principal amount outstanding (SPPI). Debt instruments are measured ot FVOC if both of the following conditions are met and the asset is not designated as FUTPL: (a) the asset is held within a business model that is Held-to-Collect and Sell (HTC&S) os described below, and (b) the contractual terms of the instrument give rise, on specified dotes, to cash flows that are SPP All other debt instruments are measured at FVTPL Equity instruments are measured at FVTPL, unless the asset is not held for trading purposes and we make on irrevocable election to designate the asset os FVOCI. This election is made on an instrument-by-instrument bosis. $ 107 241 Allowance for credit losses For the year ended October 31, 2021 October 31, 2020 Bolonce o Provision Exchange Balance Balance ot Provision Exchange Balance beginning for credit Net rate and at end beginning for credit Net rote ond at end (Millions of Conodion dollars) of period losses write-offs (0) other of period of period losses write-olls (1) other of period Retail Residential mortgages 518 $ (43) $ (27) $ (32) $ 416 $ 402 $ 190 $ (34) $ (40) $ 518 Personal 1,309 23 (247) (6) 1,079 935 801 (411) (16) 1.309 Credit cards 1.246 (72) (297) (2) 875 832 900 (484) (2) 1.246 Small business 140 12 (23) 48 177 61 117 (31) (7) 140 Wholesale 2,795 (560) (200) (238) 1.797 1,165 2.140 (380) (130) 2,795 Customers' liability under acceptances (32) 75 24 83 107 $ 6,115 $ (672) $ (794) $ (230) $4,419 $ 3.419 $ 4,231 S (1,340) $ (195) $6,115 Presented as: Allowance for loon losses $ 5,639 $4,089 $ 3.100 $5.639 Other liabilities - Provisions 363 295 363 Customers' liability under acceptances 107 75 24 Other components of equity 6 14 to Loans written off ore generally subject to continued collection efforts for a period of time following write-off. The contractual amount outstanding on loans written off during the year ended October 31, 2021 that are no longer subject to enforcement activity was 593 million (October 31, 2020 - 5193 million) The following table reconciles the opening and closing allowance for each major product of loans and commitments as determined by our modelled, scenario-weighted allowance and the application of expert credit judgment as applicable. Reconciling items include the following: Model changes, which generally comprise the impact of significant changes to the quantitative models used to estimate expected credit losses and any staging impacts that may arise. Transfers between stages, which are presumed to occur before any corresponding remeasurements of the allowance. Originations, which reflect the allowance related to assets newly recognized during the period, including those assets that were derecognized following a modification of terms. Maturities, which reflect the allowance related to assets derecognized during the period without a credit loss being incurred, including those assets that were derecognized following a modification of terms. Changes in risk, parameters and exposures, which comprise the impact of changes in model inputs or assumptions, including changes in forward-looking macroeconomic conditions, partial repayments and additional draws on existing facilities: changes in the measurement following a transfer between stages, and unwinding of the time value discount due to the possage of time in stage 1 and stage 2. 107 6 - . Notes Loons and allowance for credit losses continued Allowance for credit losses - Retail and wholesale loons ON Shape 10 1) + 1 318 14 (1) (11) (1) 0353 221 IT! 123 16 105 4141 21 38 18 144 46 7 Residentiel erogen Best Force decans Trochage Tonto Trust Orion M Chrisk porrand pos will Mecoveries chorende Bentendo 113 1541 ( ce 124) H 78 I 12541 1 017) 10 10 10 02 191 1 1 1 2 UD1 190 10 14 co 710 (9) 03 13 494 11011 19 Tel how to beginning of Porce Modelong Transfers to Trento ang Oright Chopard walls Thonetan Banned 7 (58) - 1101 120 18 1 1961 123 143 I 140 1941 2 4 10 14 TEN 5 EE 2018 95 5 5 1,346 . 364 1 140 123 723 (105 19 103 14 LIE ) 1 Creocarde Boloncerte period Por credo Trose Trento Transferstag Origem M Champion with NOVO Echange ( 16 1741 SIL cil 2 10 017 1911 761 163 23 ) 11) 5 CY 1 1 . TE 3 = 1) 140 5 07 12 Snelle Hoonetegninger Force Modelchen Teretaget Tromsten og Transfers to stop M Changed 57 (63) 13 11 11 0) 21 who 36 (1) 12 (43) 16 110 02 19 28 (2) 132 9 2331 7 writes cos tate 20 TE 13 1 35 14 93 3,795 5 25 17 24 (76 161 160 (29 2001 581 (13 141 601 11401 221 11 121) 10 wesele egingo period Profource Model Ti H Hng Hi. mesto Trasferta stage Mac kond wie ene Indende 114 (500 109 ful 100 (47 430 0331 3 55 44 (2311 53 TI (253 53 I 4 1411 25 ISO ISE 10 17 3665 761 14 117 995 1101 13 US 2799 417 1.19T C Note 31 Parent company information The following table presents information regarding the legal entity of Royal Bank of Canada with its subsidiaries presented on on equity accounted basis Condensed Balance Sheets O Assets 2021 2020 Cash and due from banks Interest-bearing deposits with bonks 97.6175 109,397 Securities 56.896 21.603 Investments in bonk subsidiaries ond associated corporations 153.780 146.524 Investments in other subsidiaries and associated corporations 43,546 41.029 Assets purchased under reverse repurchase agreements and securities borrowed 80,216 76,358 Loans, net of allowance for loan losses 125,590 134037 Other assets 601.742 554,173 155,421 171.622 Liabilities and shareholders' equity $ 1,314,80% 1.254.743 Deposits Net balonces due to bank subsidiaries $ 854,833 5 782637 Net balances due to other subsidiaries 28.201 42,157 Other liabilities 38,309 36.421 285.447 297.261 Subordinated debentures 1.206.790 1.158.476 Shareholders' equity 9.351 9,603 98,667 86,664 $ 1.314,808 S mu Bank refers primarily to redted deposit taking institutions and securities 1.254.743 Condensed Statements of Income and comprehensive Income For the year ended October October (Millions of Canadian dollars) 2021 2020 Interest and dividend income (1) S 19,7935 23,596 Interest expense 5,615 9.548 Net interest income 14,178 14,048 Non-interest income (2) 5,393 4,792 Total revenue 19.571 18,840 Provision for credit losses (606) 3,888 Non-interest expense 9.466 9,580 Income before income taxes 10,711 5,372 Income taxes 2,088 1.139 Net income before equity in undistributed income of subsidiaries 8,623 4,233 Equity in undistributed income of subsidiaries 7,415 7.199 Net income $ 16,038$ 11.432 Other comprehensive income (loss), net of taxes 1,463 (1.137) Total comprehensive income $ 17.501 $ 10,295 (0) Includes dividend income from investments in subsidiaries and associated corporations of 5 million (October 31, 2020 - 577 million) (2) Includes a nominal shore of profit (loss) from associated corporations (October 31, 2020 - nominal) ensure that they remain valid. The capitolottribution methodologies involve a number of assumptions thot ore revised prions and methodologies and our monorement reporting fromework ore periodically reviewed by us to periodically Per Camercial $ 12,621 5.725 1346 (187) For the year and October 2011 Ines ww They Capital Management Insurance Corte Services Market Support 2.689 $ 5 4605 4,5535 10,607 (321) 5.600 1,704 5.614 421 13.296 5.600 2,164 10.157 100 (47) (1) 1509) (1) United Total Conado States inter 20.002S 13,947 5 4.4475 1.605 29.691 15.454 SORT 6.154 49.693 29.401 12.530 7,762 1753) (203) (277) (273) 9,929 3,891 596 1.59 5.422 405 3.891 25.924 2,036 12.N92 9.107 1,855 3.920 10.555 2.703 7.8475 Misol Candles Net interest income (2) Non interest income Total revenue Provision for credit losses Insurance policyholder benefits claims and acquisition expense Non interest expense Net income foss) before income taxes Income taxes recoveries) Net income Non interest expense includes Depreciation and amortization Impairment of other Intangibles Total assets Total ossets include Additions to premises and equipment and intangibles Total liabilities 3.414 788 2.6265 1.114 225 889 $ 553 1:03 5.269 1.082 4,1875 (304) (365) 615 20,631 14.671 4.551 1.599 16,050 11.072 5 1,700 649 3,0515 5 2,260 333 1.927 4405 $ 9215 5835 59 $ 1975 2.5635 1.5945 725 241 3 1 2 18 29 16 11 2 5549.702 $ 145.990 $ 22.724 $240.055 5 692.2755 52.574 51.706.323 5964,747 5454,949 5 286,627 5 5035 5549.619 5 455 805 355 149,096 $ 22.966 5239,960 $ 691,767 S 4595 2.1975 1.2385 7395 220 (45.847) $1.607,561 5866.287 5454,903 5 286,371 523 (383) 180 For the year ended Odober 3030 Personal Investors Comercial Wealth Treasury Capitol Corporate United Monte Canadian doll Other Banking Management (3) Insurance Services Markets (0) Support Total Conado Stotes International Net interest income (2) 5 12.568 2.860 5 3295 5.135 5 (57) 20,835 5 14,1855 4.9595 1.691 Non-Interest income 3.163 9270 5.361 1.982 4.749 (179) 26346 13.510 6.775 6.061 Total revenue 17.731 12.130 5.361 2.311 9.884 (236) 47.181 27.695 11.734 7.752 Provision for credit losses 2.891 214 6 1.239 1 4351 2,881 9:49 Insurance policyholder benefits. claims and acquisition expense 3.683 3,683 Non-interest expense 1.993 7.946 9.123 592 1589 5.362 1,690 146 24,758 12.513 8,380 3.865 Net income foss) before income taxes 6.894 2.793 1,086 716 3,283 Income taxes (recoveries) 14.389 1.807 639 255 10,308 2.405 1.676 507 (436) 2.952 2,516 209 227 Net Income 5 5.0875 2.1545 8315 5365 2.776 5 585 11.4375 7.7925 2.1965 1,449 Non-interest expense includes Depreciation and amortization $ 929 5 8795 58 5 2175 5125 Impairment of other 2,6065 1.5875 7255 294 Intangibles 1 7 6 28 42 40 1 1 Total assets 5509.679 129,706 5 21.253 S 230,695 5.688.0545 45.161 $ 1.624548 911.932 5431,423 5 281.143 Total assets include: Additions to premises and equipment and intangibles 7225 7045 46 5 101 5 4525 5595 2.5845 1.4545 706 5 Total liabilities 5509,682 5 129.673 $ 21.311 $ 230,618 S 688 314 5 (41.817) $ 1.537,781 5 825,034 5431,570 281,177 (1) Table equivalent bosis (2) Interest revenue is reported neto interest expense as we rely primarily on neinterest income ose performance measure OD Effective 04 2021. going losses) on economic hedges of our US shore based compensation plons, which are reflected in revenue and related variabilety in shore bosed compensation expense driven by changes in the fair value of abilities relating to our US shore based compensation plans have been reclassified from our Wealth Management segment to Corporate Support Comparative amounts have been reclassified to conform with this presentation 0.79 Selected balance sheet and other information (7) 4.9% 4.8% n.m. 10 bps Total assets Securities, net of applicable allowance $ 1,706,323 $ 1,624,548 $ 81.775 5.0% 284,724 Loans, net of allowance for loan losses 275,814 8,910 3.2% Derivative related assets 717,575 660,992 56,583 8.6% Deposits 95,541 113.488 (17.947) (15.8)% 1.100,831 Common equity 1,011,885 88.946 8.8% Total risk weighted assets 91.983 80.719 11,264 14.0% 552,541 Assets under management (AUM) (3) 546,242 6,299 1.2% Assets under administration (AUA) O). (*) 1,008,700 843,600 165,100 19.6% 6,347,300 5,891,200 456,100 7.7% Common share information Shares outstanding (000s) - average basic 1.424,343 1,423,915 428 0.0% - average diluted 1,426,735 1,428,770 (2,035) (0.1) - end of period 1,424,525 1.422,473 2,052 0.1% Dividends declared per common shore $ 4.32 $ 4.29 $ Dividend yield (3) 0.03 3.8% 4.7% n.m. (90) bps Dividend payout rotio (3) 39% 55% n.m. (1600) bps Common share price (RY on TSX) () $ 128.82 $ 93.16 $ 35.66 38.3% Market capitalization (TSX) (%) 183,507 132,518 50,989 38.5% Business information (number of Employees (full-time equivalent) (FTE) 85,301 83,842 1,459 1.7% Bank branches 1,295 (2.6) Automated teller machines (ATM) 4,378 4,557 (179) (3.9) Period average USS equivalent of C$1.00 (10) $ 0.796 $ 0.744 $ 0.052 7.0 Period end USS equivalent of CS1.00 0.808 S 0.751 $ 0.057 7.5% (0) Effective Q4 2021, goins forses) on economic hedges of our U.S.share-based compensation plons, which are reflected in revenue and related variability in shore bored compensation expense driven by changes in the fair value of liabilities relating to our US share based compensation plans have been reclassified from our Wealth Management segment to Corporate Support. Comparative amounts have been reclassified to conform with his presentation (2) Average amounts are calculated using methods intended to approximate the average of the dolly balances for the period. This includes average common equity used in the calculation of HOE. For further details, refer to the Key performance and non-GAAP measures section (3) See Glossary for composition of this measure. (4) LCR is the average for the three months ended for each respective period and is calculated in accordance with the office of the Superintendent of Financial institutions (OSFI) Liquidity Adequacy Requirements (LAR) guidance. For further details, refer to the Liquidity and funding risk section (5) Beginning in Q1 2021. OsFirequires Conodion Domestic Systemically important Banks (DSB) to disclose the NSFR on a prospective basis. The SFR is calculated in occordance with OSFI's Liquidity Adequacy Requirements (LAR) guideline. For further details, refer to the Liquidity and funding risk section (6) Capitol ratios are calculated using OSF's Capital Adequacy Requirements (CAR) guideline and the Leverage ratio is calculated using OSFI's Leverage Requirements (LR) guideline (7) Represents year-end spot balonces (8) AUA includes sis billion and 53 billion (2020 - $16 billion and $7 billion) of securitired residential mortgages and credit card loons, respectively (9) Based on TSX closing market price at period end 16) Average amounts are calculated using month-end spot rotes for the period no not applicable m. not meaningful Monagement's Discussion and Analysis 14 Royal Bank of Conodo: Annual Report 2021 1.329 (34) Page 1: Introduce the company's most recent year, by writing a short paragraph. This paragraph will not describe the company (you will assume that the reader knows about the company), but rather you will write a few things that have happened in the company, during its most recent year. Page 1: name four financial ratios that you would like to use, to analyze your company. Write a brief sentence, telling the reader what each ratio will reveal about the company. Your analysis should have a variety of ratios (one or two solvency ratios, one liquidity ratio, one or two profitability ratios, for example); please check with your instructor if you are not sure which ratios to select. Pages 2 & 3: assess your company using each of the four financial ratios above. Succinctly write the ratio formula. Calculate your company's ratio using the current year's numbers (from the annual report) AND calculate the same ratio using numbers from the previous year. Include the date of the numbers that you use to calculate the ratio (month/year). For some companies, this might be October 2018 and October 2019, if a company has a fiscal year-end of October 30, for example. For other companies, you might be able to access 2020 reports, with financial ratios from March 2019 and March 2020, for example. Page 4: Write two, separate, brief paragraphs with your financial analysis, based on the results of the four ratios. Do the ratios show improvement in the financial health of the company? Explain (briefly) why or why not. 1 long-term wholesale lobilities. Required stable funding is driven mainly by the bank's mortgage and loon portfolio secured loons Available stable funding is comprised primarily of o diversified pool or personal and commercial deposits.capitol, as well as to financial institutions and to a lesser extent by other less liquid assets. NSFR does not reflect any unused morket funding copacity that we believe is available to the bank Volume and composition of available stable funding is actively managed to optimize our structural funding position and meet NSFR objectives. Our NSFR is monaged in accordance with our comprehensive RMF 04 2021 vs. Q3 2021 The NSER os ot October 31, 2021 was 116 which translates into a surplus of approximately $114 billion, compared to 116% ondo surplus of opproximately sto billion in the prior quarter. NSFR has remained stable compared to the previous quarter os growth In retail and wholesale loons was offset by the issuance of term funding and increases in client deposits Contractual moturities of financial assets, financial liabilities and off balance sheet items The following tobles provide remaining contractual maturity profiles of oll our assets. liabilities, and off balance sheet items at their carrying value (eg, amortized cost or fair value) at the balance sheet dote Off-bolance sheet items are allocated based on the expiry date of the contract Details of contractual maturities ond commitments to extend funds are a source of information for the monagement of liquidity risk Among other purposes, these details for a basis for modelling a behavioural balance sheet with effective motunities to calculate liquidity risk measures. For further details, refer to the risk measurement section Contractual maturities of financial assets, financial liabilities and off-balance sheet items Table 62 As of October 31.2021 with no Less than 1103 3. sto tot Iyer 2 years years specific (Manel Comedian dollar months months to 2 years to 5 years and greater maturity Total Assets Cash and deposits with banka $199,9955 25 -5 -5 2.486 193.484 Securities Trading 67.655 46 6 20 169 9.545 Investment, et of applicable 61,171 139,240 allowance 431 5.54 5.832 5.314 22.366 1.193 62.289 511 145,454 Asus purchased under reverse purchase agreements and securities borrowed 104301 59,612 31.6 22.982 16 95 Loons net of applicable once 22.259 307.903 28317 21.610 26.014 31.910 26921 OSO 296659 Ocher 62.215 2.579 717.575 Customers' ability under acceptances 1265 5 (75) Derivatives 5.125 19.795 10.788 334 3.505 10,139 17.890 39.73) 9 95,541 Other Financial assets 1.535 LE 545 135 270 277 2.044 3.351 42.836 Total Financial assets 449,516 135,621 39.657 65.246 57.143 121.950 3-4.33 176,136 Other non financial 172.491 1,661 861 6,07 1.651 711 155 1.957 2.177 5.89 25.904 44.461 Total assets 55.895 $137.302 321 6461 $ 52.73 $ 171.907 350.765 152.024 5.195.1955 1.706,323 Liabilities and equity Deposits Unsecured borrowing $ 52.133440555 36.319 3647 5.35.792 5 30,63545.7455 Secured borrow 13.320 561.924 $ 1.01) SOS 2.442 4.244 7.54 2.104 9.557 15040 6.118 32.110 2.403 5.350 1321 8,122 37.213 12,653 7,207 5 1 19,873 Oblications related to secure sold short 37.541 obligations related to assets old 37.341 underrepurchase rements and securities booned 168.763 62338 5.610 4.10 661 Derivatives 19.252 5.456 9.90 4938 2.767 262,201 9.211 Other financials 15.727 36.733 1 91.439 33.49 1.299 104 373 1.000 2.115 Subordinated debentures 10.326 795 50.784 18 110 1.912 7.383 9.593 Total financiallibilities 342.21 129,99 75.44) 4606 563526 101.560 Other non financial Site 56.902 6.907 581.953 1.572,562 210 155 1.103 1.172 13.360 9.910 34999 Equity 91.762 95,762 Total liabilities and equity $ 344491 S 136.504 576097 5 52.617 5 44.1615 57.634 5 103.0325 100.262 $790.625 $ 1.706.323 Oll-balance sheet items Financial guarantees 1 387 1,950 $ 2.99 $ 2.933 5 2,206 S 1.8295 3.3265 Commitments to extend credit 1.151 5.564 5.338 16,367 11,400 16231 12.024 56.651 Other credit related commitment 160,789 16,733 4.544 966 1.064 1.536 1.376 289.911 370 726 35 Other commitments 101 99.115 11 20 107.450 144 275 615 1.276 Total off-balance sheet items 36 $ 15.555 $ 20,716 5 15.627 $35.951 3 164.95 13.230 5 105.0385 415,516 Trading debt securities couled VTPL been included in the stomach copy there is no expectation to hold these assets to the contractual maturity () Open reverserepe and repo control which have outdoor short term. have been included in the with specific mority category (2) Amejor portion of relationship based deposits are repoble on demandes contractul in practice these customer balonces forme core bose for our operations and liquidity needs splined in the preceding Deposit and founder section 315 overed bond Acceptances Royal Bank of Cand Annual Report 2021 Management's Discussion and Analysis As at October 31, 2020 with no Less than 2006 110 6109 90 1 year 5 years 2 years Specific (Millions of Canadian dollars) Total month months months months months and greater to 2 years maturity to 5 years Assets 25 5155.418 5 - 5 - 5 Cosh and deposits with bonis 3 3 $ 157.901 2.481 5 - 5 Securities Trading (1) 52.486 51 49 25 80 so 98 9,615 43,617 136071 Inwestment, net of applicable allowance 3.211 4,762 6,445 10,765 9079 26.313 25.315 53,355 496 139,743 Assets purchased under reverse repurchase agreements and securities borrowed (?). () 147,453 62.905 47211 25.083 9.990 2 20.371 313,015 Loans, net of applicable allowance 21.593 24.742 28.236 25.951 132,783 266,935 56.253 80,165 660,992 Other Customers' liability under acceptances 12.157 6,402 50 5 (107) 18,507 Derivatives 5.035 10.946 4,932 3.433 13.550 20,205 52.650 11 113.488 Other financial assets 32,713 2,741 1,520 499 71 323 257 2,099 2.692 42.915 Total Financial assets 462.909 109.402 84.949 68041 47.897 173,021 312,815 173,972 149.726 1.582.632 Other non-financial assets 4.540 1.411 97 360 234 1.939 1,802 5,988 25.045 41.916 Total assets $467.349 $ 110,813 385.046 $ 68,901 $ 48,131 3.174,960 3-314617 5 179,960 $ 174.771 $ 1.624,548 Liabilities and equity Deposits (4) Unsecured borrowing $75.380 $ 36,569 $ 56.348 $ 35,881 $30.676 $23.293 $ 52,029 $ Secured borrowing 15.360 5590.020 $ 915,556 2.704 6,605 4,022 6,242 4.142 7,400 18.705 6.427 56,337 Covered bonds 1.942 5.412 1.295 2.501 3,707 16,195 8,940 Other 39,992 Acceptances 12.155 6,401 50 9 Obligations related to securities 18.618 sold short 29.285 Obligations related to assets sold 29,285 under repurchase agreements and securities looned (2.0) 215.514 19,396 20,606 1.492 Derivatives 4.971 4.467 11.576 11,553 4.423 3.355 2.709 274.231 Other financial liabilities (3) 11.900 50.396 34.768 20.985 2.187 1.140 477 139 109,927 430 Subordinated debentures 851 2.180 10.994 563 53,590 205 110 9.552 Totol financial liabilities 9.867 374.666 84.653 92,001 Other non-financial liabilities 47,626 41.950 52,327 110.204 1.053 5.395 209 101.669 212 602,307 1.507.403 Equity 193 951 1,010 11.910 9.445 30,378 Total liabilities and equity 86,767 5375.7195 90,048 5 92.210 $ 47,838 S 42.143 553,278 $ 111,214 $ 86,767 off balance sheet items 113.579 5698,519 5 1,624,548 Financial guarantees 5 4015 Commitments to extend credit 1,745 $ 2.1865 3,137 53,004 S 5.255 700 5 4,803 14821 4,529 $ 1.3835 16,163 Other credit related commitments 565 12.306 45,633 1.982 17.141 161.524 903 1,634 1.745 16,876 1.400 Other commitments 4,828 282,239 260 7 20 20 623 10 78,768 20 82 87,325 Total off-balance sheet items 209 344 $ 7,675 57,465 $18.661 5 21,065 5 16,730 $ 46,675 5 166,885 S 1.267 Trading debt securities classified as PVTPL have been included in the less than 1 month category as there is no expectation to hold these assets to their contractual 18.613 $84.203 S 387,972 maturity (2) Open reverse repo and repo contracts, which have no set maturity date and are typically short term have been included in the with no specific maturity category (3) Amounts previously presented were reclassified to reflect the contractual maturities of certain financial assets and liabilities 14 A major portion of relationship based deposits are repayable on demand or ot short notice on a contractual bosis while, in practice, these customer balances forma core base for our operations and liquidity needs, os explained in the preceding Deposit and funding profile section 376 551 Contractual maturities of financial liabilities and off bolonce sheet items - undiscounted basis The following tobles provide remaining contractual maturity analysis of our financial liabilities and off balance sheet items. The amounts disclosed in the following toble are the contractual undiscounted cash flows of all financial liabilities les por value or amount payable upon maturity). The amounts do not reconcile directly with those in our consolidated balance sheets as the table incorporates only cash flows relating to payments on maturity and do not recognise premiums, discounts or mark to market adjustments recognized in the instruments carrying values as at the balance sheet date. Financial liabilities are based upon the earliest period in which they are required to be paid for off balonce sheet items the undiscounted cash flows potentially payable under financial guarantees and commitments to extend credit are classified on the basis of the earliest dote they con be called Contractual maturities of financial liabilities and off-balance sheet items - undiscounted basis Table 63 As et detaber 3 2021 year (Mahone Canadian dollars 2 years 5 years yrer to years and greater Total Financial liabilities Deposits $ 576,161 5367.389 $44.951 $ 78,071 S 33,063 5 1,099,635 Other Acceptances T 19,867 5 Obligations related to securities sold short 19.873 37.462 37,462 Obligations related to assets sold under repurchase ogreements and securities loaned 19,234 242.314 Other liabilities 262.217 620 35.984 384 544 Lease liabilities 7.873 45.405 631 582 1.522 2,342 5.077 Subordinated debentures 188 110 1.916 7.392 9.606 596.016 703.835 46,701 82,053 50,670 1,479,275 off-balance sheet items Financial guarantees (2) 5 16,867 $ $ 5 - $ 5 16,867 Commitments to extend credit car 81 82 209 344 716 248,594 41.238 77 2 289.911 265.461 41,319 159 211 344 307.494 Total financial liabilities and off-balance sheet items $ 861.477 5745,154 546,860 $ 82.264 5 51,014 $ 1,786,769 669 As October 31 2000 within year ( Mons of Canadian dollars) 2 years Syers demand to 2 years 10 years and greater Total Financial liabilities Deposits (1.4) $S10.849 $ 350,298 $ 34,618 5 85.1985 29,832 5 1,010,795 Other Acceptances 9 18,609 Obligations related to securities sold short 18,618 29.121 Obligations related to assets sold under repurchase 29.121 agreements and securities loaned (4) 11,576 257.684 4.971 274.231 Other liabilities 199 37.681 188 358 8,678 47,104 Lease liabilities 633 604 1.545 2.575 Subordinated debentures 5,357 205 110 9,552 9.867 522,633 694,026 40,586 87,211 50,637 1.395,093 off-balance sheet items Financial guarantees (2) $ 17,1415 $ - $ $ $ Other commitments) 17.141 81 82 209 344 716 Commitments to extend credit 2 239.212 43,025 2 282.239 256,353 43,106 84 209 344 300,096 Total financial liabilities and off-balance sheet items$ 778,986 $ 737,132 $ 40,670 $ 87,420 S 50.981 5 1.695.189 . This table represents an integral part of our 2071 Annual Consolidated Financial Statements (1) A major portion of relationship based deposits are repoyable on demand or ot short notice on contractual basis while, in practice these customer balonces forma core bose for our operations and liquidity needs, as explained in the preceding Deposit and funding profile (3) We believe that it is highly unlikely that all or substantially all of these guarantees and commitments will be drown of settled within one year, and contracts may expire without being drown or settled. The management of the liquidity risk associated with 


Step by Step Solution
There are 3 Steps involved in it
Step: 1

Get Instant Access to Expert-Tailored Solutions
See step-by-step solutions with expert insights and AI powered tools for academic success
Step: 2

Step: 3

Ace Your Homework with AI
Get the answers you need in no time with our AI-driven, step-by-step assistance
Get Started


