conduct a financial anaysis for mattel for 2017, 2016, and 2015 using any six of the following financial ratios: current ratio, return on equity, operating profit margin, coverage ratio, net profit margin, detb asset ratio, and detb to equity. show your work. tabulate your result.
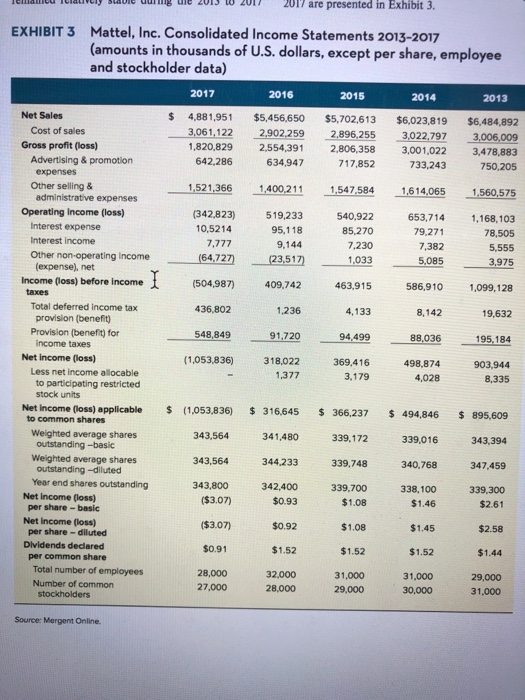
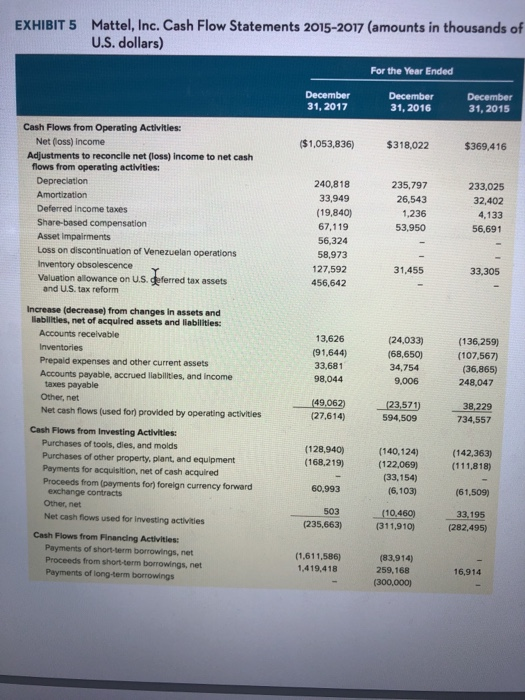
VILN I 2013 W w 2017 are presented in Exhibit 3. EXHIBIT 3 Mattel, Inc. Consolidated Income Statements 2013-2017 (amounts in thousands of U.S. dollars, except per share, employee and stockholder data) 2017 2016 2015 2014 2013 Net Sales 4,881,951 $5,456,650 $5.702,613 $6,023,819 $6.484,892 Cost of sales 3,061,122 2,902,259 2,896,255 3,022,797 3,006,009 Gross profit (loss) 1,820,829 2.554,391 2,806,358 3,001,022 3 ,478,883 Advertising & promotion 642,286 634.947 717,852 733,243 750,205 expenses Otherseling & 1,521,366 1,400,211 1,547,584 1,614,065 1,560,575 administrative expenses Operating Income (loss) (342,823) 519,233 540.922 653,714 1,168,103 Interest expense 10,5214 95,118 85.270 79,271 78,505 Interest income 7.777 9,144 7,230 7,382 5,555 Other non-operating Income (54,727 (23,517) 1,033 5,085 3,975 (expense), net Income (loss) before income (504,987) 409,742 463,915 586,910 1,099,128 taxes Total deferred Income tax 436,802 1,236 4,133 8,142 19,632 provision (benefit Provision (benefit) for 548,849 91.720 94,499 88,036 195,184 Income taxes Net Income (loss) (1,053,836) 318,022 369,416 498,874 903.944 Less net income allocable 1,377 3,179 4,028 8.335 to participating restricted stock units Net Income (loss) applicable $ (1.053,836) $ 316,645 $ 366,237 $ 494,846 $ 895,609 to common shares Weighted average shares 343,564 341,480 339,172 339,016 343,394 outstanding-basic Weighted average shares 343,564 344.233 339.748 340.768 347,459 outstanding-diluted Year end shares outstanding 343,800 342,400 339,700 338,100 339,300 Net Income loss) ($3.07) $0.93 $1.08 $1.46 $2.61 per share-basic Net Income foss) ($3.07) $0.92 $1.08 $1.45 $2.58 per share-diluted Dividends declared $0.91 $1.52 $1.52 $1.52 $1.44 per common share Total number of employees 28,000 32.000 31,000 31,000 29,000 Number of common 27,000 28,000 29,000 30,000 31.000 stockholders Source: Mergent Online EXHIBIT 5 Mattel, Inc. Cash Flow Statements 2015-2017 (amounts in thousands of U.S. dollars) For the Year Ended December 31, 2017 December 31, 2016 December 31, 2015 ($1,053,836) $318,022 $369,416 Cash Flows from Operating Activities: Net (loss) Income Adjustments to reconcile net (loss) Income to net cash flows from operating activities: Depreciation Amortization Deferred Income taxes Share-based compensation Asset impairments Loss on discontinuation of Venezuelan operations Inventory obsolescence Valuation allowance on U.S. eferred tax assets and US, tax reform 235,797 26,543 1,236 53,950 240,818 33,949 (19,840) 67,119 56,324 58,973 127,592 456,642 233,025 32,402 4,133 56,691 31,455 33,305 13,626 (91,644) 33,681 98,044 (24,033) (68,650) 34,754 9.006 (136,259) (107,567) (36,865) 248,047 (49,062) (27.614) (23.571) 594,509 38,229 734,557 Increase (decrease) from changes in assets and liabilities, net of acquired assets and liabilities: Accounts receivable Inventories Prepaid expenses and other current assets Accounts payable, accrued liabilities, and income taxes payable Othernet Net cash flows (used for provided by operating activities Cash Flows from Investing Activities: Purchases of tools, dies, and molds Purchases of other property, plant, and equipment Payments for acquisition, net of cash acquired Proceeds from (payments for) foreign currency forward exchange contracts Othernet Net cash flows used for investing activities Cash Flows from Financing Activities Payments of short-term borrowings, net Proceeds from short-term borrowings, net Payments of long-term borrowings (128,940) (168.219) (140,124) (122,069) (33,154) (6,103) (142,363) (111,818) 60,993 (61,509) 503 (235,663) (10.460) (311,910) 33.195 (282,495) (1,611,586) 1,419,418 (83,914) 259,168 (300,000) 16,914


