conduct a sensitivity analysis for each variable and range and compute the NPV for each. Use the spread and accompanying data as a starting point for the analysis
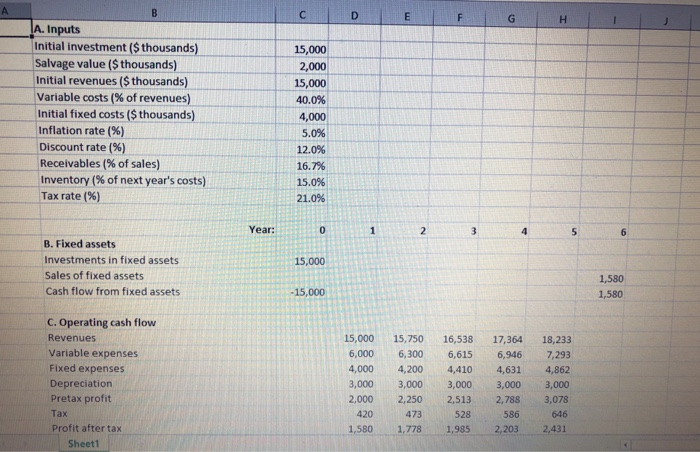
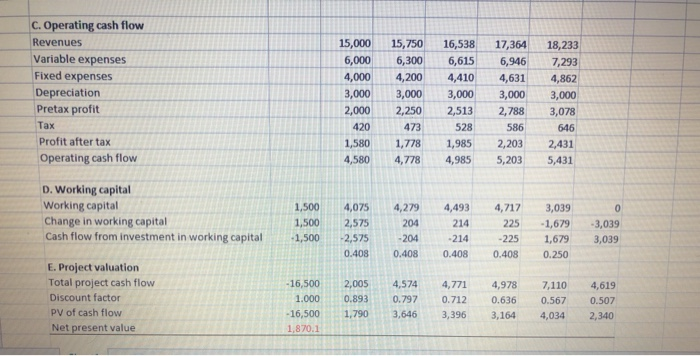
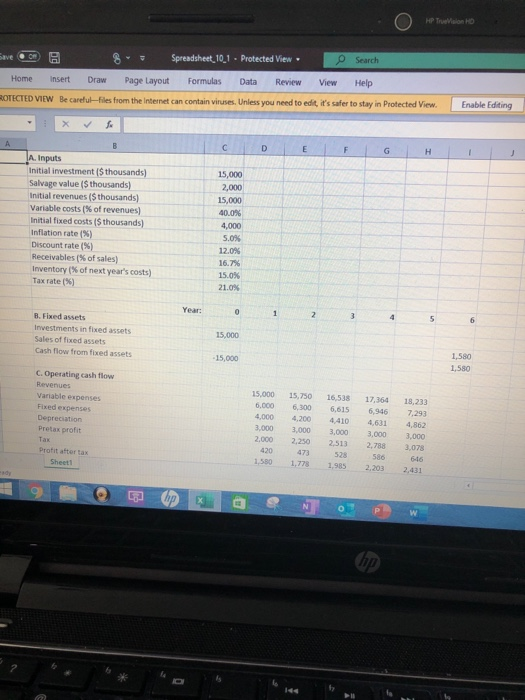
this is the spreadsheet
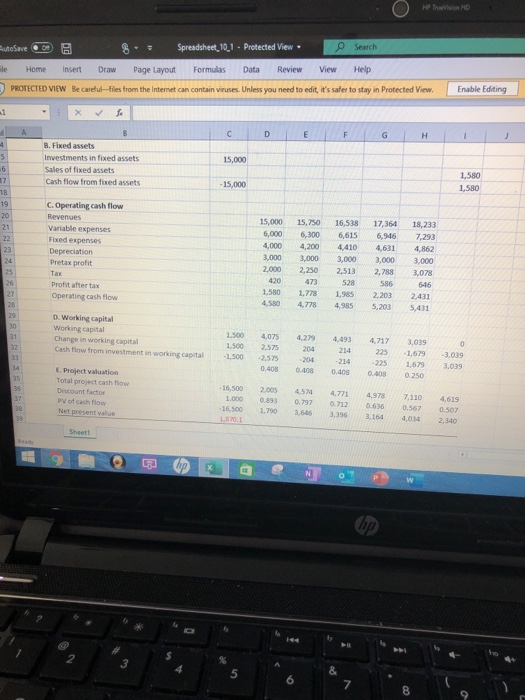
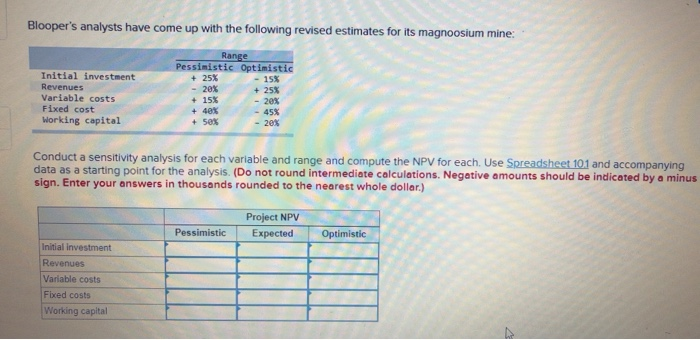
Blooper's analysts have come up with the following revised estimates for its magnoosium mine Range Pessimistic Optimistic + 25% 20% Initial investment Revenues Variable costs Fixed cost Working capital Conduct a sensitivity analysis for each variable and range and compute the NPV for each. Use Spreadsheet 101 and accompanying data as a starting point for the analysis. (Do not round Intermediate calculations. Negative amounts should be indicated by a minus sign. Enter your answers in thousands rounded to the nearest whole dollar) Project NPV Expected Pessimistic Optimistic Initial investment Revenues Variable costs Fixed costs Working capital G H J A. Inputs Initial investment ($thousands) Salvage value ($thousands) Initial revenues ($ thousands) Variable costs (% of revenues) Initial fixed costs ($ thousands) Inflation rate (%) Discount rate (%) Receivables (% of sales) Inventory (% of next year's costs) Tax rate (%) 15,000 2,000 15,000 40.0% 4,000 5.0% 12.0% 16.7% 15.0% 21.0% Year: 15,000 B. Fixed assets Investments in fixed assets Sales of fixed assets Cash flow from fixed assets 1,580 1,580 C. Operating cash flow Revenues Variable expenses Fixed expenses Depreciation Pretax profit Tax Profit after tax Sheet1 15,000 6,000 4,000 3,000 2,000 420 1,580 15,750 6,300 4,200 3,000 2,250 473 1.778 16,5381 7,364 6,615 6,946 4,410 4,631 3,000 3,000 2,513 2,788 528 586 1,985 2,203 18,233 7,293 4,862 3,000 3,078 646 2,431 15,000 6,000 C. Operating cash flow Revenues Variable expenses Fixed expenses Depreciation Pretax profit Tax Profit after tax Operating cash flow 4,000 3,000 2,000 420 1,580 4,580 15,750 6,300 4,200 3,000 2,250 473 1,778 4,778 16,538 6,615 4,410 3,000 2,513 528 1,985 4,985 17,364 6,946 4,631 3,000 2,788 586 2,203 5,203 18,233 7,293 4,862 3,000 3,078 6416 2.431 5,431 1,500 D. Working capital Working capital Change in working capital Cash flow from investment in working capital 1.500 4,075 2,575 -2,575 0.408 4,279 204 -204 0.408 4,493 214 -214 0.408 -1,500 4,717 225 -225 0.408 3,039 -1,679 1,679 0.250 3,039 3,039 E. Project valuation Total project cash flow Discount factor PV of cash flow Net present value - 16,500 1.000 - 16,500 1.870.1 2,005 0.893 1,790 4,574 0.797 3.646 4,771 0.712 3,396 4,978 0.636 ,164 7,110 0.567 4,034 4,619 0.507 2,340 3 C D nove ODD B le Home Insert PROTECTED VIEW Be cul 8 Spreadsheet10_1. Protected View Search Draw Page Layout Formulas Data Review View Help ties from the Internet can contain viruses. Unless you need to edit, it's safer to stay in Protected View Enable Editing B. Fedets Investments in fied assets Sales offredssts Carth how from fixed sets C. Operating cash flow Revenues Vusable expenses Fixed expenses Depreciation Pretax profit 15 000 6.000 4,000 3,000 2.000 420 15.750 6.300 4200 3,000 2.250 473 1.773 4,778 16.538 17,364 6,615 6. 5 410 4.631 3,000 3,000 2.513 2,788 586 1,985 2,203 495 5.20 18.233 7.293 4.352 3,000 078 616 2431 5.431 Profit after Operating cash flow 4,580 D. Working capital Working capital Change in working capital Cash flow from investment in working capital 1.500 1.500 -1.500 2.573 3.575 204 4.493 214 4.717 225 204 3039 1,679 1.67 0.250 3,019 3,019 0.03 Project valuation Totalprot tashow Discount factor evol cash flow 7110 45471 077712 3.156 4,619 0.507 15.500 3.506 15 12 0 HP TrueVision HD Save R S Spreadsheet 10,1 . Protected View Search Home Insert Draw Page Layout Formulas Data Review View Help ROTECTED VIEW Be careful-files from the Internet can contain viruses. Unless you need to edit, it's safer to stay in Protected View Enable Editing c o E F G H I 1A. Inputs Initial investment ($thousands) Salvage value ($thousands) Initial revenues ($thousands) Variable costs % of revenues) Initial fixed costs (thousands) Inflation rate (%) Discount rate(%) Receivables (% of sales) Inventory (% of next year's costs) Tax rate (9) 15,000 2,000 15,000 40.0 4,000 5.0% 12.0% 16.7% 15.0% 21.0% B. Fixed assets Investments in fixed assets Sales of fixed assets Cash flow from fixed assets 15,000 1.580 1,580 C. Operating cash flow Revenues Variable expenses Fixed expenses Depreciation Pretax profit 15.000 6.000 4,000 3.000 2.000 420 1.580 15.750 6.300 4,200 3,000 2.250 473 1.778 16.538 6615 4.410 3,000 2513 528 1.985 17,364 5.946 4.631 3.000 2,588 2,788 586 2.203 18.233 7.293 4.362 3.000 3,078 Profit attortas 2.431 hp