

Answered step by step
Verified Expert Solution
Question
1 Approved Answer
Conduct a trend analysis (time-series) for various ratios to interpret the results and identify potential problems. Ratio Analysis Disney Rations: Liquidity Current-35,251/26,628= 1.32383 Quick-35,251-3,754/26,628 =
Conduct a trend analysis (time-series) for various ratios to interpret the results and identify potential problems.
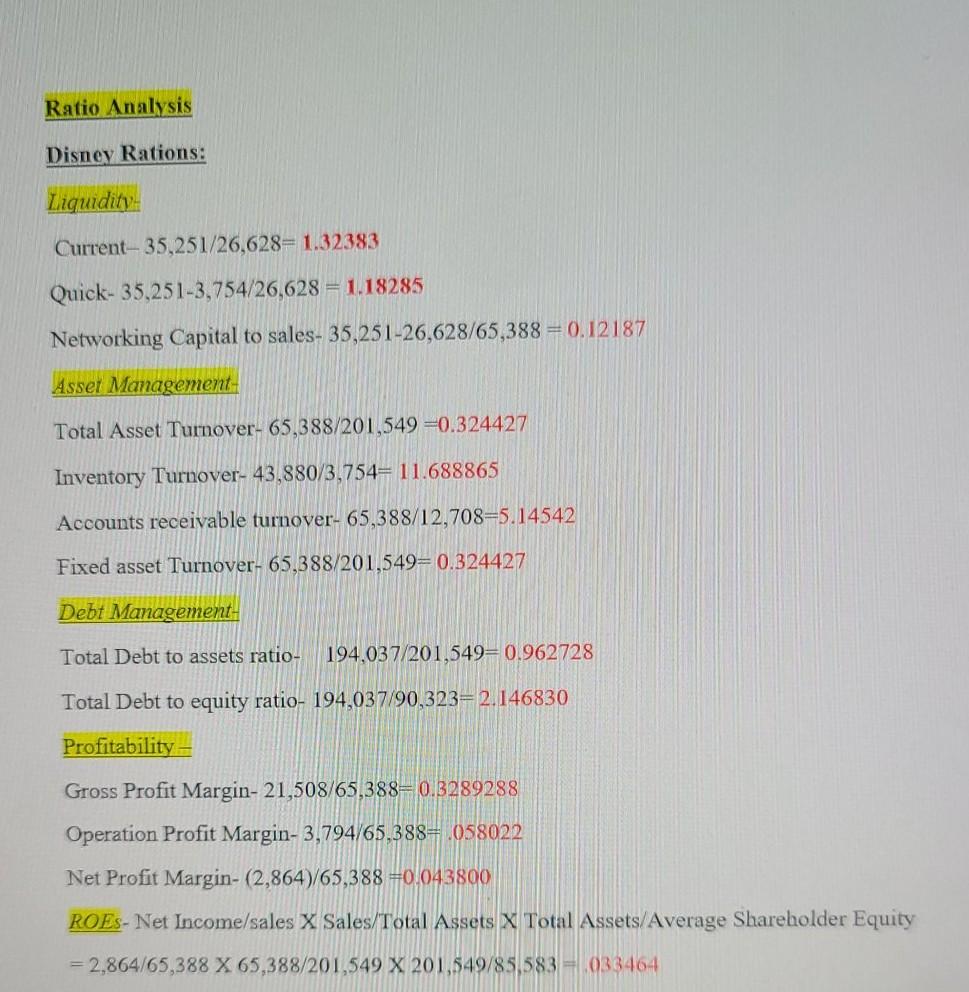
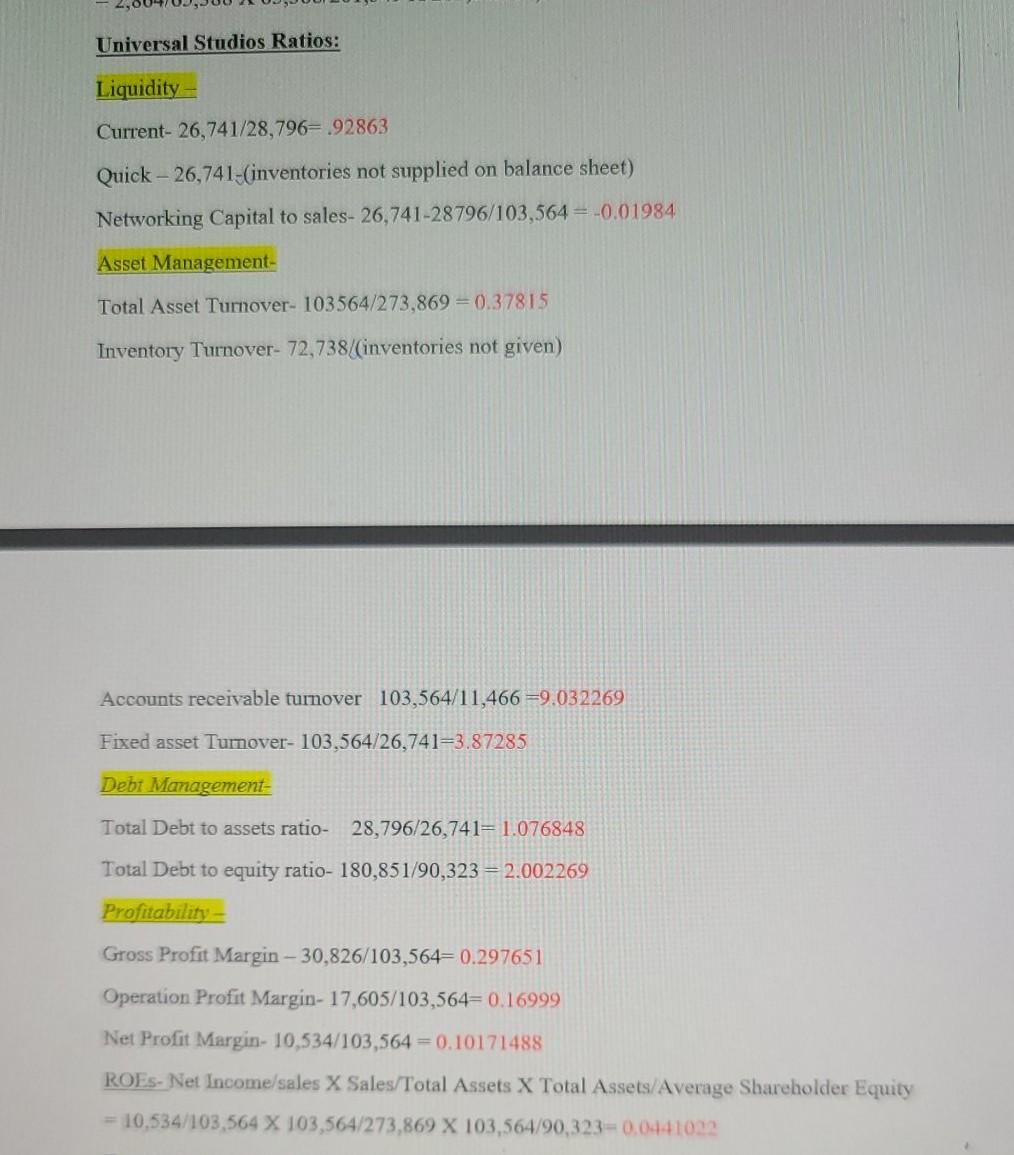
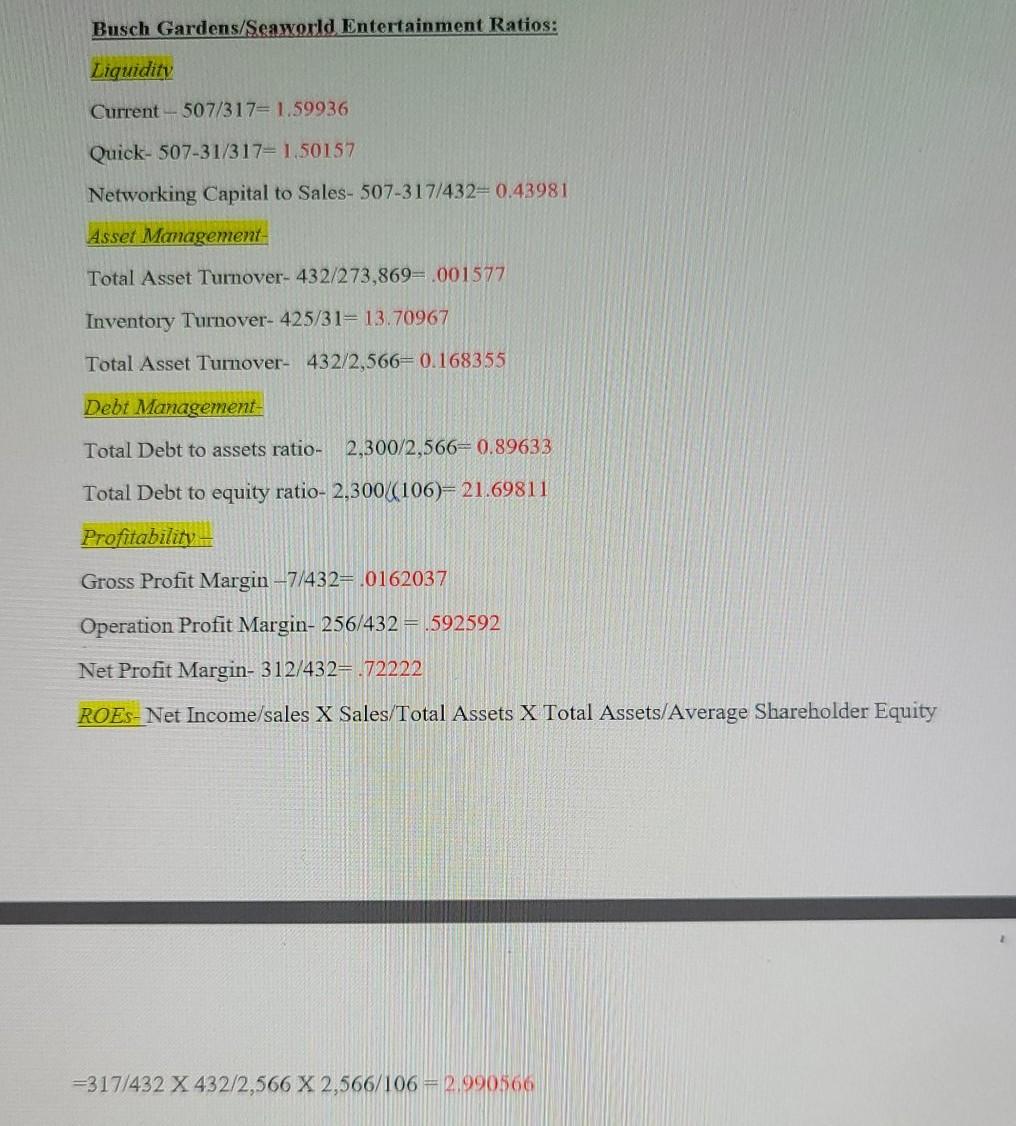
Ratio Analysis Disney Rations: Liquidity Current-35,251/26,628= 1.32383 Quick-35,251-3,754/26,628 = 1.18285 Networking Capital to sales- 35,251-26,628/65,388 = 0.12187 Asset Management- Total Asset Turnover- 65,388/201,549 =0.324427 Inventory Turnover- 43,880/3,754= 11.688865 Accounts receivable turnover-65,388/12,708=5.14542 Fixed asset Turnover-65,388/201,549=0.324427 Debt Management- Total Debt to assets ratio- 194,037/201,549= 0.962728 Total Debt to equity ratio- 194,037/90,323=2.146830 Profitability Gross Profit Margin- 21,508/65,388= 0.3289288 Operation Profit Margin-3,794/65,388= 2058022 Net Profit Margin- (2,864)/65,388 =0.043800 ROES- Net Income sales X Sales/Total Assets X Total Assets/Average Shareholder Equity = 2,864/65,388 X 65,388/201,549 X 201,549/85,583 = 033464 Universal Studios Ratios: Liquidity Current-26,741/28,796= .92863 Quick - 26,741-(inventories not supplied on balance sheet) Networking Capital to sales- 26,741-28796/103,564 = -0.01984 Asset Management- Total Asset Turnover- 103564/273,869 = 0.37815 Inventory Turnover- 72,738/(inventories not given) Accounts receivable turnover 103,564/11,466 =9,032269 Fixed asset Tummover- 103,564/26,741=3.87285 Debt Management- Total Debt to assets ratio- 28,796/26,741= 1.076848 Total Debt to equity ratio- 180,851/90,323 = 2.002269 Profitability Gross Profit Margin - 30,826/103,564= 0.297651 Operation Profit Margin- 17,605/103,564=0.16999 Net Profit Margin- 10,534/103,564 = 0.10171488 ROES- Net Income/sales X Sales/Total Assets X Total Assets/Average Shareholder Equity = 10,534/103,564 X 103,564/273,869 X 103,564/90,323=0.0441022 Busch Gardens/Seaworld Entertainment Ratios: Liquidity Current - 507/317= 1.59936 Quick-507-31/317= 1.50157 Networking Capital to Sales- 507-317/432=0.43981 Asset Management Total Asset Turnover-432/273,869= .001577 Inventory Turnover-425/31= 13.70967 Total Asset Turnover- 432/2,566= 0.168355 Debt Management- Total Debt to assets ratio- 2,300/2,566= 0.89633 Total Debt to equity ratio- 2,300/(106)= 21.69811 Profitability - Gross Profit Margin-7/432= .0162037 Operation Profit Margin- 256/432 = .592592 Net Profit Margin- 312/432= .72222 ROES- Net Income/sales X Sales/Total Assets X Total Assets/Average Shareholder Equity =317/432 X 432/2,566 X 2,566/106 = 2.990566
Step by Step Solution
There are 3 Steps involved in it
Step: 1

Get Instant Access to Expert-Tailored Solutions
See step-by-step solutions with expert insights and AI powered tools for academic success
Step: 2

Step: 3
Ace Your Homework with AI
Get the answers you need in no time with our AI-driven, step-by-step assistance
Get Started
Ebay Tips And Tricks To Increase Your Ebay Sales
Authors: Jessica Wilson
1st Edition
1774854015, 978-1774854013