Answered step by step
Verified Expert Solution
Question
1 Approved Answer
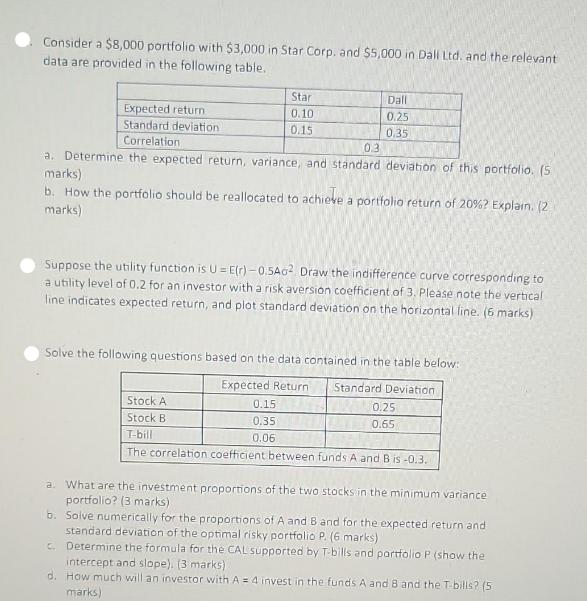
Consider a $8,000 portfolio with $3,000 in Star Corp. and $5,000 in Dall Ltd. and the relevant data are provided in the following table.

Consider a $8,000 portfolio with $3,000 in Star Corp. and $5,000 in Dall Ltd. and the relevant data are provided in the following table. Star 0.10 0.15 Dall 0.25 0.35 Expected return Standard deviation Correlation. 0.3 a. Determine the expected return, variance, and standard deviation of this portfolio. (5 marks) b. How the portfolio should be reallocated to achieve a portfolio return of 20%? Explain. (2 marks) Suppose the utility function is U = E(r)-0.5A0 Draw the indifference curve corresponding to a utility level of 0.2 for an investor with a risk aversion coefficient of 3. Please note the vertical line indicates expected return, and plot standard deviation on the horizontal line. (6 marks) Solve the following questions based on the data contained in the table below: Expected Return Standard Deviation 0.15 0.35 0.06 Stock A Stock B T-bill The correlation coefficient between funds A and B is -0.3. 0.25 0.65 a. What are the investment proportions of the two stocks in the minimum variance portfolio? (3 marks) b. Solve numerically for the proportions of A and B and for the expected return and standard deviation of the optimal risky portfolio P. (6 marks) c. Determine the formula for the CAL supported by T-bills and portfolio P (show the intercept and slope). (3 marks) d. How much will an investor with A = 4 invest in the funds A and 8 and the T bills? (5 marks)
Step by Step Solution
★★★★★
3.46 Rating (156 Votes )
There are 3 Steps involved in it
Step: 1
SOLUTION a To determine the expected return variance and standard deviation of the portfolio we need to use the following formulas Expected Return of ...
Get Instant Access to Expert-Tailored Solutions
See step-by-step solutions with expert insights and AI powered tools for academic success
Step: 2

Step: 3

Ace Your Homework with AI
Get the answers you need in no time with our AI-driven, step-by-step assistance
Get Started


