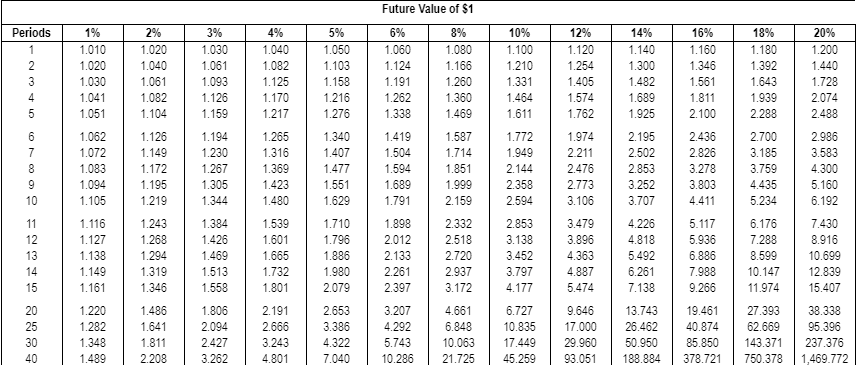
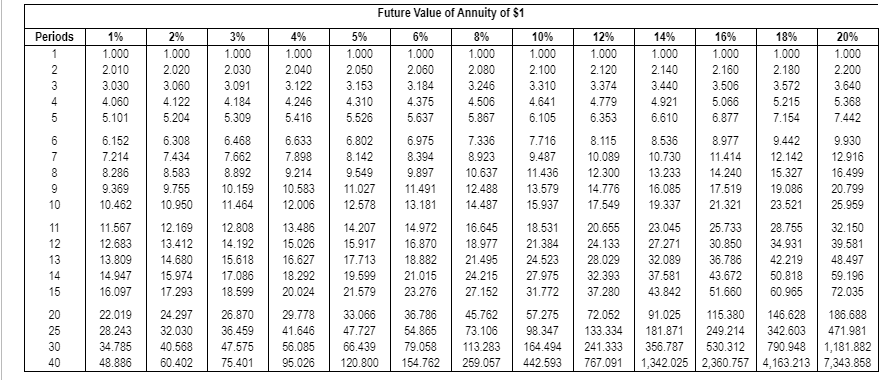
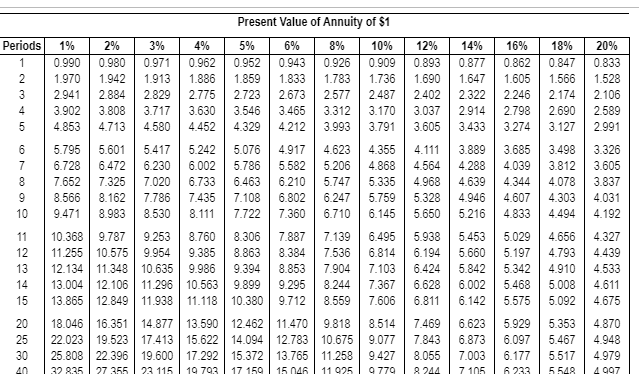
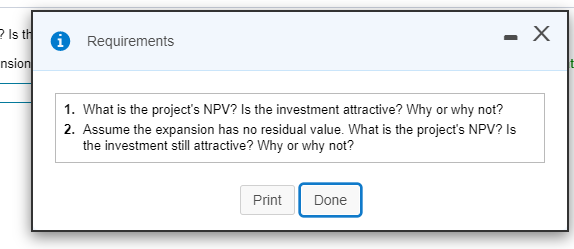
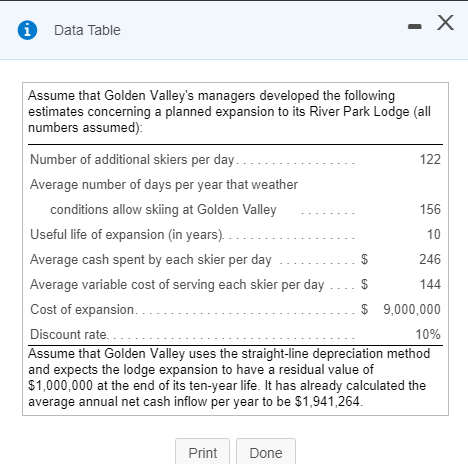
Consider how Golden Valley, a popular ski resort, could use capital budgeting to decide whether the $ 9 million River Park Lodge expansion would be a good investment. LOADING...(Click the icon to view the expansion estimates.) LOADING...(Click the icon to view the present value annuity factor table.) LOADING...(Click the icon to view the present value factor table.) LOADING...(Click the icon to view the future value annuity factor table.) LOADING...(Click the icon to view the future value factor table.) Read the requirementsLOADING.... Requirement 1. What is the project's NPV? Is the investment attractive? Why or why not? Calculate the net present value of the expansion. (Round your answer to the nearest whole dollar. Use parentheses or a minus sign for a negative net present value.) Net present value of expansion 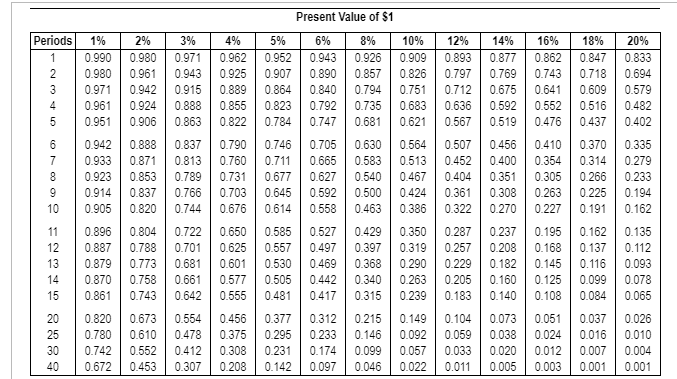
 NEED TO ZOOM-IN ON PICTURES. THIS IS AS CLEAR AS I CAN GET THEM.
Present Value of $1 Periods 1% 2% 3% 0.990 0.980 0.971 0.9800.961 0.943 0.971 0.942 0.915 0.961 0.924 0.888 0.951 0.906 0.863 0.942 0.888 0.837 0.933 0.871 0.813 0.923 0.853 0.789 0.914 0.837 0.766 0.905 0.820 0.744 0.896 0.8040.722 0.887 0.788 0.701 0.879 0.773 0.681 0.870 | 0.758 0.661 0.861 0.743 0.642 0.820 0.673 0.554 0.780 | 0.610 0.478 0.742 0.552 0.412 0.672 0.453 0.307 4% 0.962 0.925 0.889 0.855 0.822 0.790 0.760 0.731 0.703 0.676 0.650 0.625 0.601 0.577 0.555 0.456 0.375 0.308 0.208 5% 6% 0.952 0.943 0.907 0.890 0.864 0.840 0.823 0.792 0.784 | 0.747 0.746 0.705 0.711 0.665 0.677 0.627 0.6450.592 0.614 0.558 0.585 0.527 0.557 0.497 0.530 0.469 0.505 0.442 0.481 0.417 0.377 0.312 0.295 0.233 0.231 0.174 0.142 0.097 8% 0.926 0.857 | 0.794 0.735 0.681 0.630 0.583 0.540 0.500 0.463 0.429 0.397 0.368 0.340 0.315 0.215 0.146 0.099 0.046 10% 0.909 0.826 0.751 0.683 0.621 0.564 0.513 0.467 0.424 0.386 0.350 0.319 0.290 0.263 0.239 0.149 0.092 0.057 0.022 12% 14% 0.893 0.877 | 0.797 0.769 0.712 0.675 0.636 0.592 0.567 0.519 0.507 0.456 0.452 0.400 0.404 0.351 0.361 0.308 0.322 0.270 0.287 0.237 0.257 0.208 0.229 | 0.182 | 0.205 | 0.160 0.183 0.140 0.104 0.073 0.059 0.038 0.033 0.020 0.0110.005 16% 0.862 0.743 0.641 | 0.552 0.476 0.410 0.354 0.305 0.263 0.227 0.195 0.168 0.145 0.125 0.108 0.051 0.024 0.012 0.003 18% 20% | 0.847 0.833 0.7180.694 0.609 0.579 0.516 0.482 0.437 0.402 0.370 0.335 0.314 0.279 0.266 | 0.233 0.225 0.194 0.191 0.162 0.162 0.135 0.137 0.112 0.116 0.093 0.099 0.078 0.084 0.065 0.037 | 0.026 0.016 0.010 0.007 0.004 0.001 0.001 Future Value of $1 Periods 3% 1% 1.010 1.020 1.030 1.041 1.051 1.062 1.072 1.083 1.094 1.105 2% 1.020 1.040 1.061 1.082 1.104 4% 1.040 1.082 1.125 1.170 1.217 1.265 1.316 1.369 1.423 10% 1.100 1.210 1.331 1.464 1.611 1.772 1.949 2.144 6% 1.060 1.124 1.191 1.262 1.338 1.419 1.504 1.594 1.689 1.791 1.898 2.012 2.133 2.261 2.397 1.030 1.061 1.093 1.126 1.159 1.194 1.230 1.267 1.305 1.344 1.384 1.426 1.469 1.513 1.558 1.806 2.094 2.427 3.262 2.358 5% 1.050 1.103 1.158 1.216 1.276 1.340 1.407 1.477 1.551 1.629 1.710 1.796 1.886 1.980 2.079 2.653 3.386 4.322 7.040 12% 1.120 1.254 1.405 1.574 1.762 1.974 2.211 2.476 2.773 3.106 1.126 1.149 1.172 1.195 1.219 1.243 1.268 1.294 1.319 1.346 1.486 1.641 1.811 2.208 1.480 8% 1.080 1.166 1.260 1.360 1.469 1.587 1.714 1.851 1.999 2.159 2.332 2.518 2.720 2.937 3.172 4.661 6.848 10.063 21.725 16% 1.160 1.346 1.561 1.811 2.100 2.436 2.826 3.278 3.803 4.411 5.117 5.936 14% 1.140 1.300 1.482 1.689 1.925 2.195 2.502 2.853 3.252 3.707 4.226 4.818 5.492 6.261 7.138 13.743 26.462 50.950 188.884 18% 1.180 1.392 1.643 1.939 2.288 2.700 3.185 3.759 4.435 5.234 6.176 7.288 8.599 10.147 11.974 27.393 62.669 143.371 750.378 20% 1.200 1.440 1.728 2.074 2.488 2.986 3.583 4.300 5.160 6.192 7.430 8.916 10.699 12.839 15.407 38.338 95.396 237.376 1,469.772 2.594 2.853 3.138 3.452 3.797 4.177 6.727 10.835 17.449 45.259 1.116 1.127 1.138 1.149 1.161 1.220 1.282 1.348 1.489 6.886 1.539 1.601 1.665 1.732 1.801 2.191 2.666 3.243 4.801 3.479 3.896 4.363 4.887 5.474 3.207 7.988 9.266 19.461 40.874 85.850 378.721 9.646 17.000 29.960 93.051 4.292 5.743 10.286 Periods 4% 18% 1.000 2.180 3.572 5.215 1% 1.000 2.010 3.030 4.060 5.101 6.152 7.214 8.286 9.369 10.462 11.567 12.683 2% 1.000 2.020 3.060 4.122 5.204 6.308 7.434 8.583 9.755 10.950 12.169 13.412 14.680 15.974 17.293 24.297 32.030 40.568 60.402 3% 1.000 2.030 3.091 4.184 5.309 6.468 7.662 8.892 10.159 11.464 12.808 14.192 15.618 17.086 18.599 26.870 36.459 47.575 75.401 Future Value of Annuity of $1 5% 6% 8% 10% 1.000 1.000 1.000 11.000 2.050 2.060 2.080 2.100 3.153 3.184 3.246 3.310 4.310 4.375 4.506 4.641 5.526 5.637 5.867 6.105 6.802 6.975 7.336 7.716 8.142 8.394 8.923 9.487 9.549 9.897 10.637 11.436 11.027 11.491 12.488 13.579 12.578 13.181 14.487 14.207 14.972 16.645 15.917 16.870 18.977 17.713 21.495 19.599 21.015 24.215 21.579 23.276 27.152 31.772 33.066 36.786 45.762 57.275 47.727 54.865 73.106 98.347 66.439 79.058 113.283 164 494 120.800 154.762 259.057 442.593 20% 1.000 2.200 3.640 5.368 7.442 9.930 12.916 16.499 20.799 1.000 2.040 3.122 4.246 5.416 6.633 7.898 9.214 10.583 12.006 13.486 15.026 16.627 18.292 20.024 29.778 41.646 56.085 95.026 12% 1.000 2.120 3.374 4.779 6.353 8.115 10.089 12.300 14.776 17.549 20.655 24.133 14% 1.000 2.140 3.440 4.921 6.610 8.536 10.730 13.233 16.085 19.337 23.045 27.271 32.089 37.581 43.842 91.025 181.871 356.787 1,342.025 16% 1.000 2.160 3.506 5.066 6.877 8.977 11.414 14.240 17.519 21.321 25.733 30.850 36.786 43.672 51.660 115.380 249.214 530.312 2,360.757 7.154 9.442 12.142 15.327 19.086 23.521 28.755 25.959 18.882 28.029 42.219 32.393 37.280 72.052 133.334 241.333 767.091 22.019 32.150 39.581 43.497 59.196 72.035 186.688 471.981 1,181.882 7,343.858 50.818 60.965 146.628 342.603 790.948 4,163.213 28.243 34.785 48.886 Periods 1% 0.990 1.970 2.941 3.902 4.853 5.795 6.728 7.652 8.566 9.471 10.368 2% 3% 4% 0.980 0.971 | 0.962 1.942 1.913 1.886 2884 2.829 2.775 3.808 3.717 3.630 4.713 4.580 4.452 5.601 5.417 5.242 6.472 6.230 6.002 7.325 7.020 6.733 8.162 7.786 7.435 8.983 8.530 8.111 9.787 9.253 8.760 10.575 9.954 9.385 11.348 10.635 9.986 12.106 | 11.296 | 10.563 12.849 11.938 11.118 16.351 14.877 13.590 17.413 15.622 19.600 17.292 27 355 23. 115 19 793 Present Value of Annuity of $1 5% 6% 8% 10% 0.952 0.943 0.926 0.909 1.859 1.833 1.783 1.736 2.723 2.673 2.577 2487 3.546 3.465 3.312 3.170 4.329 4.212 3.993 3.791 5.076 4.917 4.623 4.355 5.786 5.582 5.206 4.868 6.463 6.210 5.747 5.335 7.108 6.802 6.247 5.759 7.722 7.360 6.710 6.145 8.306 7.887 7.139 6.495 8.863 8.384 7.536 6.814 9.394 8.853 7.904 7.103 9.899 9.295 8.244 7.367 10.380 9.712 8.559 7.606 12.462 11.470 9.818 8.514 14.094 12.783 10.675 9.077 15.372 13.765 11.258 9.427 17 159 15 046 11 925 9 779 12% 0.893 1.690 2402 3.037 3.605 4.111 4.564 4.968 5.328 5.650 5.938 14% 0.877 1.647 2.322 2.914 3.433 3.889 4.288 4.639 4.946 5.216 5.453 5.660 5.842 6.002 6.142 6.623 6.873 7.003 7 105 16% 0.862 1.605 2.246 2.798 3.274 3.685 4.039 4.344 4.607 4.833 5.029 5.197 5.342 5.468 5.575 5.929 6.097 6.177 18% 20% 0.847 0.833 1.566 1.528 2.174 2.106 2.690 2589 3.127 2.991 3.498 3.326 812 3.605 4.078 3.837 4.303 4.031 4.494 4.192 4.656 4.327 4.793 4.439 4.910 4.533 5.008 5.092 4.675 5.353 4.870 5.467 4.948 5.517 4.979 55484997 6.194 4.611 6.424 6.628 6.811 7.469 7.843 8.055 8 244 ? Is th A 1 Requirements nsion 1. What is the project's NPV? Is the investment attractive? Why or why not? 2. Assume the expansion has no residual value. What is the project's NPV? Is the investment still attractive? Why or why not? Print Done - X 0 Data Table Assume that Golden Valley's managers developed the following estimates concerning a planned expansion to its River Park Lodge (all numbers assumed): 122 Number of additional skiers per day........ Average number of days per year that weather conditions allow skiing at Golden Valley Useful life of expansion (in years) Average cash spent by each skier per day 246 Average variable cost of serving each skier per day .... $ 144 Cost of expansion......... $ 9,000,000 Discount rate................................... 10% Assume that Golden Valley uses the straight-line depreciation method and expects the lodge expansion to have a residual value of $1,000,000 at the end of its ten-year life. It has already calculated the average annual net cash inflow per year to be $1.941,264. Print Done Consider how Golden Valley, a popular ski resort, could use capital budgeting to decide whether the $9 million River Park Lodge expansion would be a good inv 2 (Click the icon to view the expansion estimates.) (Click the icon to view the present value annuity factor table.) ( 0 Data Table (Click the icon to view the future value annuity factor table.) (CI Read the requirements Assume that Golden Valley's managers developed the following estimates concerning a planned expansion to its River Park Lodge (all