Answered step by step
Verified Expert Solution
Question
1 Approved Answer
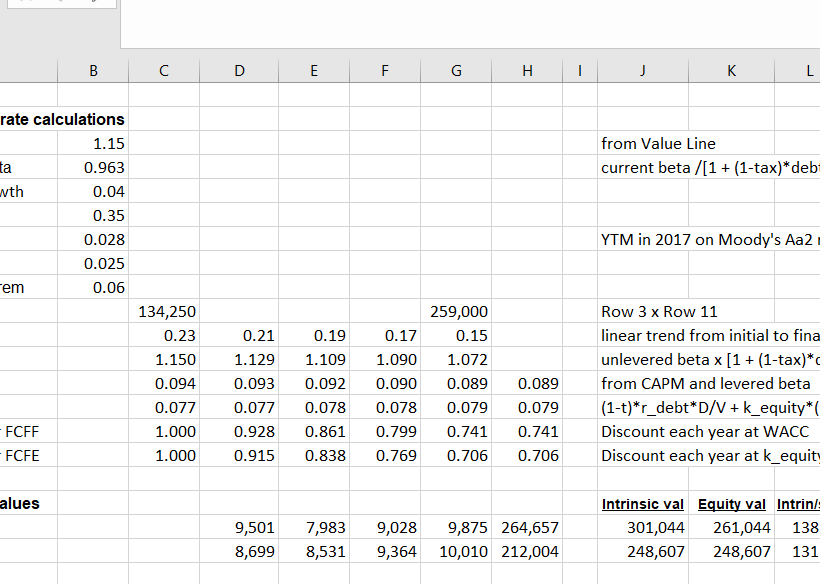
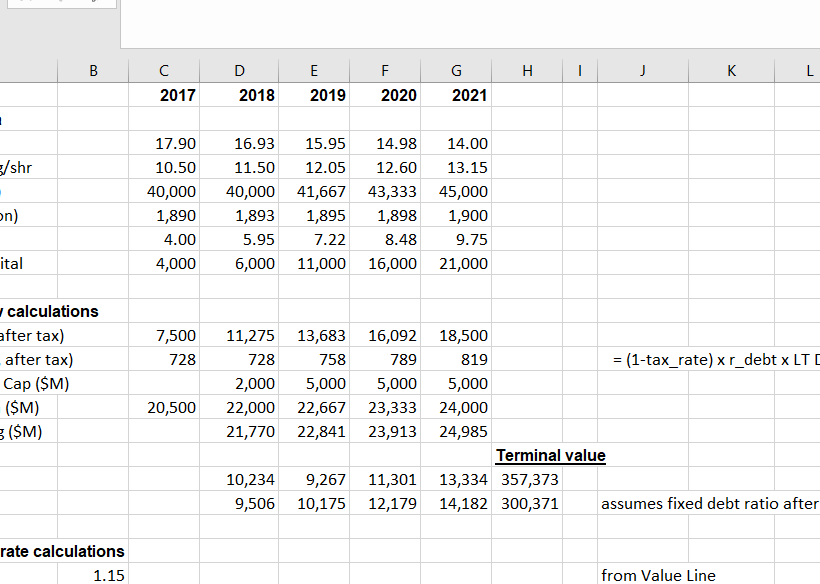
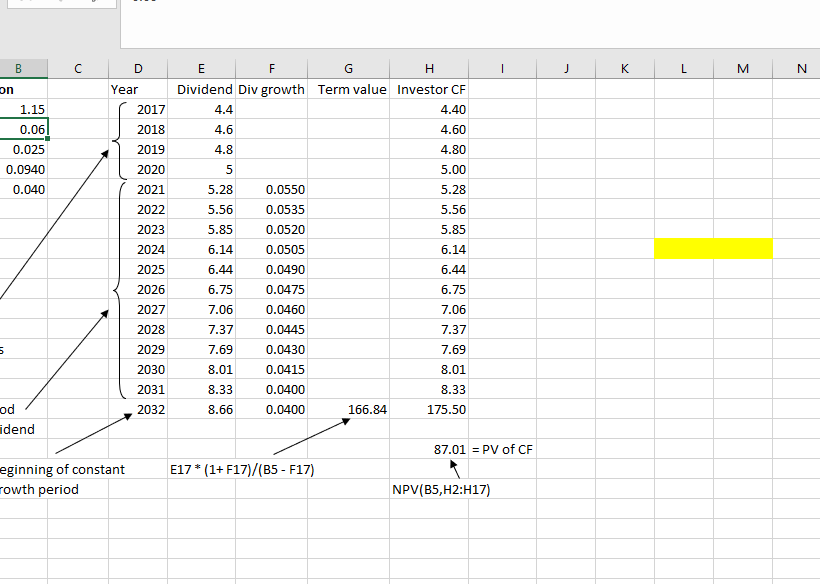
Consider reliability of data, business cycles, dividend policy, investment horizon and investors preference as well. Resort to the provided excel image examples and support your
Consider reliability of data, business cycles, dividend policy, investment horizon and investors preference as well. Resort to the provided excel image examples and support your statements with numerical explanations derived from the available examples


B C D E F F G I 1 J K L from Value Line current beta /[1 + (1-tax)*deb rate calculations 1.15 ta 0.963 wth 0.04 0.35 0.028 0.025 em 0.06 YTM in 2017 on Moody's Aa2 0.21 0.19 1.109 259,000 0.15 1.072 134,250 0.23 1.150 0.094 0.077 1.000 1.000 0.089 1.129 0.093 0.077 0.928 0.915 0.092 0.078 0.17 1.090 0.090 0.078 0.799 0.769 0.089 0.079 0.741 0.706 Row 3 x Row 11 linear trend from initial to fina unlevered beta x (1 + (1-tax)* from CAPM and levered beta (1-t)*r_debt*D/V + k_equity* Discount each year at WACC Discount each year at k_equity FCFF 0.861 0.838 0.079 0.741 0.706 FCFE alues 9,501 8,699 7,983 8,531 9,028 9,364 9,875 264,657 10,010 212,004 Intrinsic val Equity val Intrin/ 301,044 261,044 138 248,607 248,607 131 B E F H 1 J K L C 2017 D 2018 E 2019 G 2021 2020 . /shr 17.90 10.50 40,000 1,890 4.00 4,000 16.93 11.50 40,000 1,893 5.95 6,000 15.95 14.98 14.00 12.05 12.60 13.15 41,667 43,333 45,000 1,895 1,898 1,900 7.22 8.48 9.75 11,000 16,000 21,000 on) ital 7,500 728 calculations after tax) after tax) Cap ($M) (SM) 5 (SM) 20,500 11,275 13,683 16,092 18,500 728 758 789 819 = (1-tax_rate) xr_debt x LTD 2,000 5,000 5,000 5,000 22,000 22,667 23,333 24,000 21,770 22,841 23,913 24,985 Terminal value 10,234 9,267 11,301 13,334 357,373 9,506 10,175 12,179 14,182 300,371 assumes fixed debt ratio after rate calculations 1.15 from Value Line B C D J K L M N on Year 2017 1.15 0.06 E F G H Dividend Div growth Term value Investor CF 4.4 4.40 4.6 4.60 4.8 4.80 0.025 0.0940 2018 2019 2020 2021 2022 5 5.00 0.040 5.28 5.28 0.0550 0.0535 5.56 5.56 5.85 2023 0.0520 5.85 6.14 6.14 2024 2025 0.0505 0.0490 6.44 0.0475 2026 2027 6.75 7.06 6.44 6.75 7.06 0.0460 2028 7.37 0.0445 7.37 5 2029 0.0430 7.69 2030 7.69 8.01 8.33 0.0415 8.01 2031 0.0400 8.33 2032 8.66 0.0400 166.84 175.50 od idend 87.01 = PV of CF E17*(1+F17)/(B5 - F17) eginning of constant rowth period NPV(B5, H2:H17) B C D E F F G I 1 J K L from Value Line current beta /[1 + (1-tax)*deb rate calculations 1.15 ta 0.963 wth 0.04 0.35 0.028 0.025 em 0.06 YTM in 2017 on Moody's Aa2 0.21 0.19 1.109 259,000 0.15 1.072 134,250 0.23 1.150 0.094 0.077 1.000 1.000 0.089 1.129 0.093 0.077 0.928 0.915 0.092 0.078 0.17 1.090 0.090 0.078 0.799 0.769 0.089 0.079 0.741 0.706 Row 3 x Row 11 linear trend from initial to fina unlevered beta x (1 + (1-tax)* from CAPM and levered beta (1-t)*r_debt*D/V + k_equity* Discount each year at WACC Discount each year at k_equity FCFF 0.861 0.838 0.079 0.741 0.706 FCFE alues 9,501 8,699 7,983 8,531 9,028 9,364 9,875 264,657 10,010 212,004 Intrinsic val Equity val Intrin/ 301,044 261,044 138 248,607 248,607 131 B E F H 1 J K L C 2017 D 2018 E 2019 G 2021 2020 . /shr 17.90 10.50 40,000 1,890 4.00 4,000 16.93 11.50 40,000 1,893 5.95 6,000 15.95 14.98 14.00 12.05 12.60 13.15 41,667 43,333 45,000 1,895 1,898 1,900 7.22 8.48 9.75 11,000 16,000 21,000 on) ital 7,500 728 calculations after tax) after tax) Cap ($M) (SM) 5 (SM) 20,500 11,275 13,683 16,092 18,500 728 758 789 819 = (1-tax_rate) xr_debt x LTD 2,000 5,000 5,000 5,000 22,000 22,667 23,333 24,000 21,770 22,841 23,913 24,985 Terminal value 10,234 9,267 11,301 13,334 357,373 9,506 10,175 12,179 14,182 300,371 assumes fixed debt ratio after rate calculations 1.15 from Value Line B C D J K L M N on Year 2017 1.15 0.06 E F G H Dividend Div growth Term value Investor CF 4.4 4.40 4.6 4.60 4.8 4.80 0.025 0.0940 2018 2019 2020 2021 2022 5 5.00 0.040 5.28 5.28 0.0550 0.0535 5.56 5.56 5.85 2023 0.0520 5.85 6.14 6.14 2024 2025 0.0505 0.0490 6.44 0.0475 2026 2027 6.75 7.06 6.44 6.75 7.06 0.0460 2028 7.37 0.0445 7.37 5 2029 0.0430 7.69 2030 7.69 8.01 8.33 0.0415 8.01 2031 0.0400 8.33 2032 8.66 0.0400 166.84 175.50 od idend 87.01 = PV of CF E17*(1+F17)/(B5 - F17) eginning of constant rowth period NPV(B5, H2:H17)
Step by Step Solution
There are 3 Steps involved in it
Step: 1

Get Instant Access to Expert-Tailored Solutions
See step-by-step solutions with expert insights and AI powered tools for academic success
Step: 2

Step: 3

Ace Your Homework with AI
Get the answers you need in no time with our AI-driven, step-by-step assistance
Get Started


