Consider the Charles Schwab Corp. business.
Use the following link for additional information: https://finance.yahoo.com/quote/SCHW/financials?p=SCHW
Provide a thorough and detailed report based on the screenshots.
Include the following:
1. Introduction
2. Profitability - start with ratios, then walk the reader through relevant portions of revenues.
Include information from
- Income Statement
- Balance Sheet
- Cash Flow
4. Conclusion
Ratios:
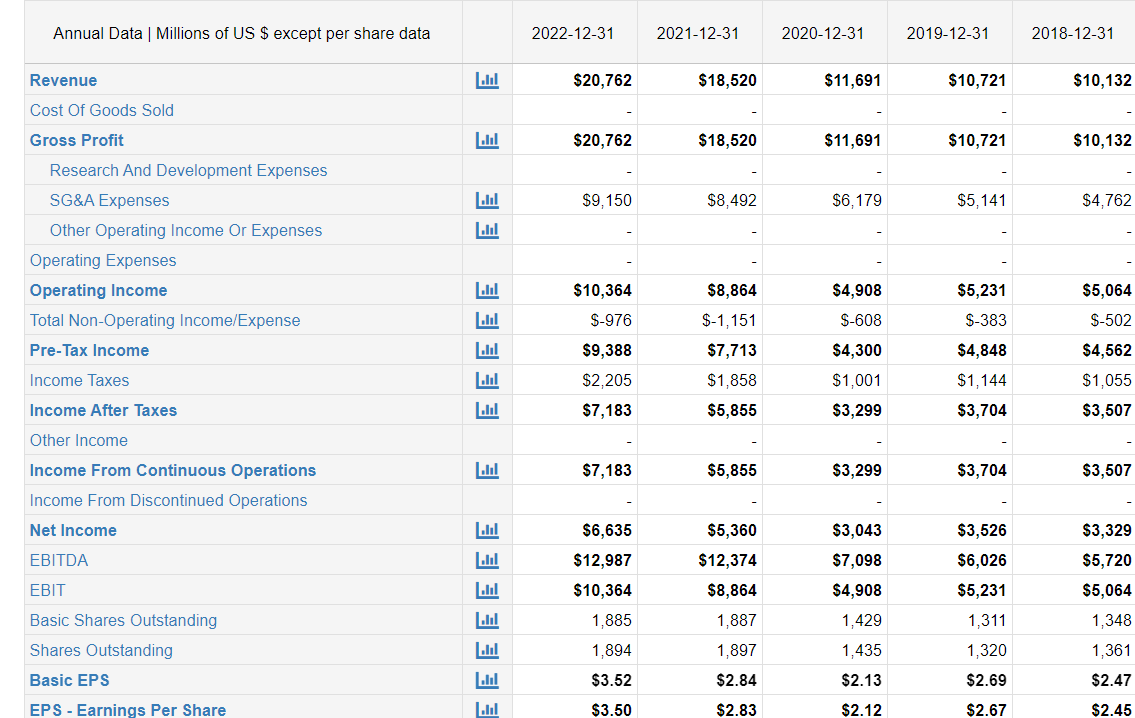
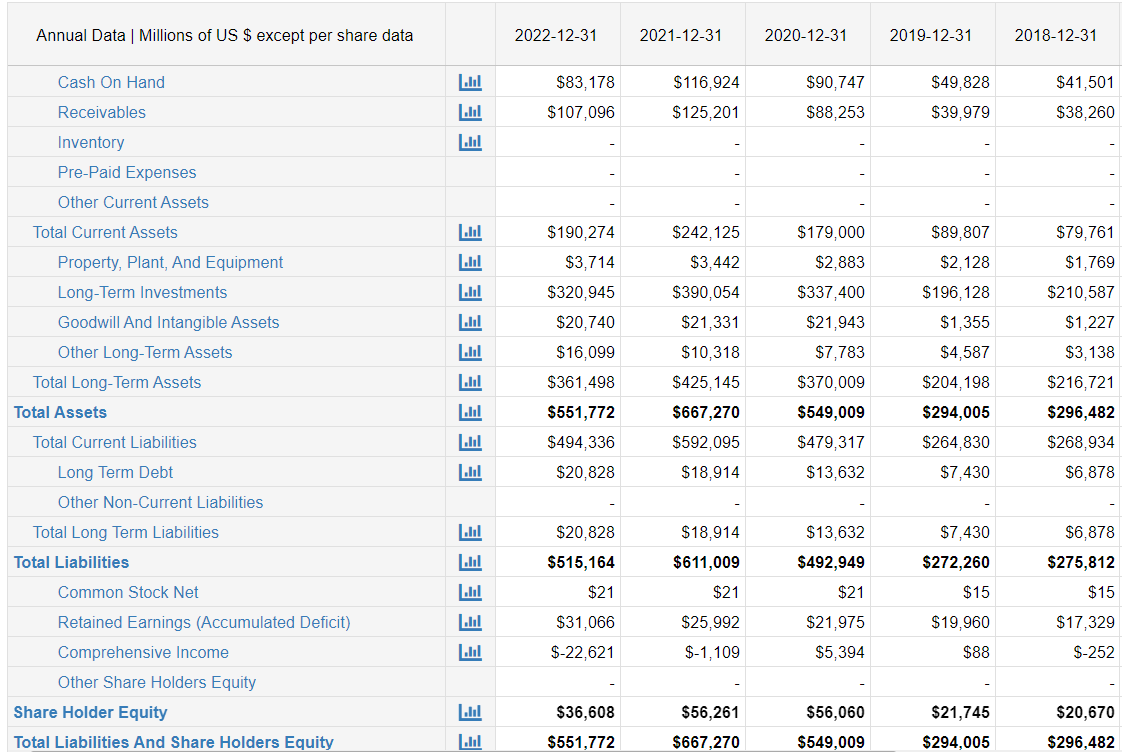
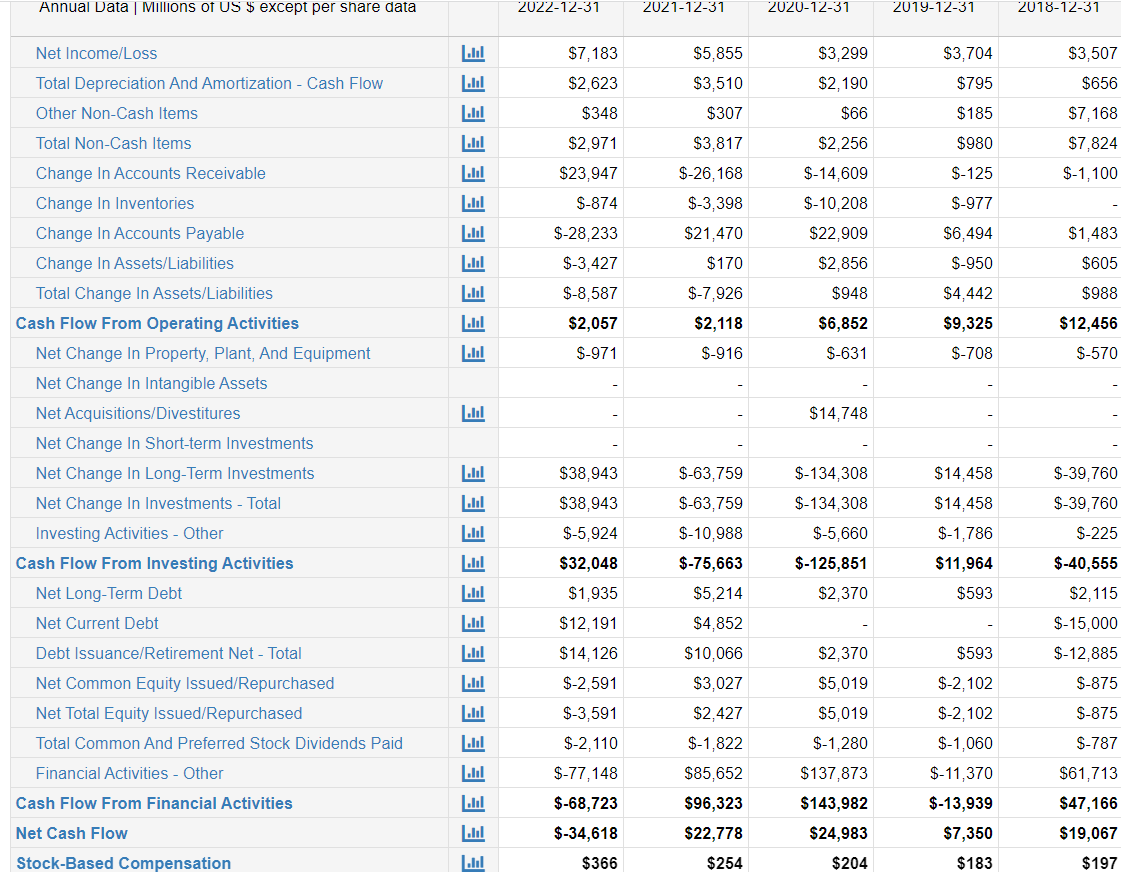
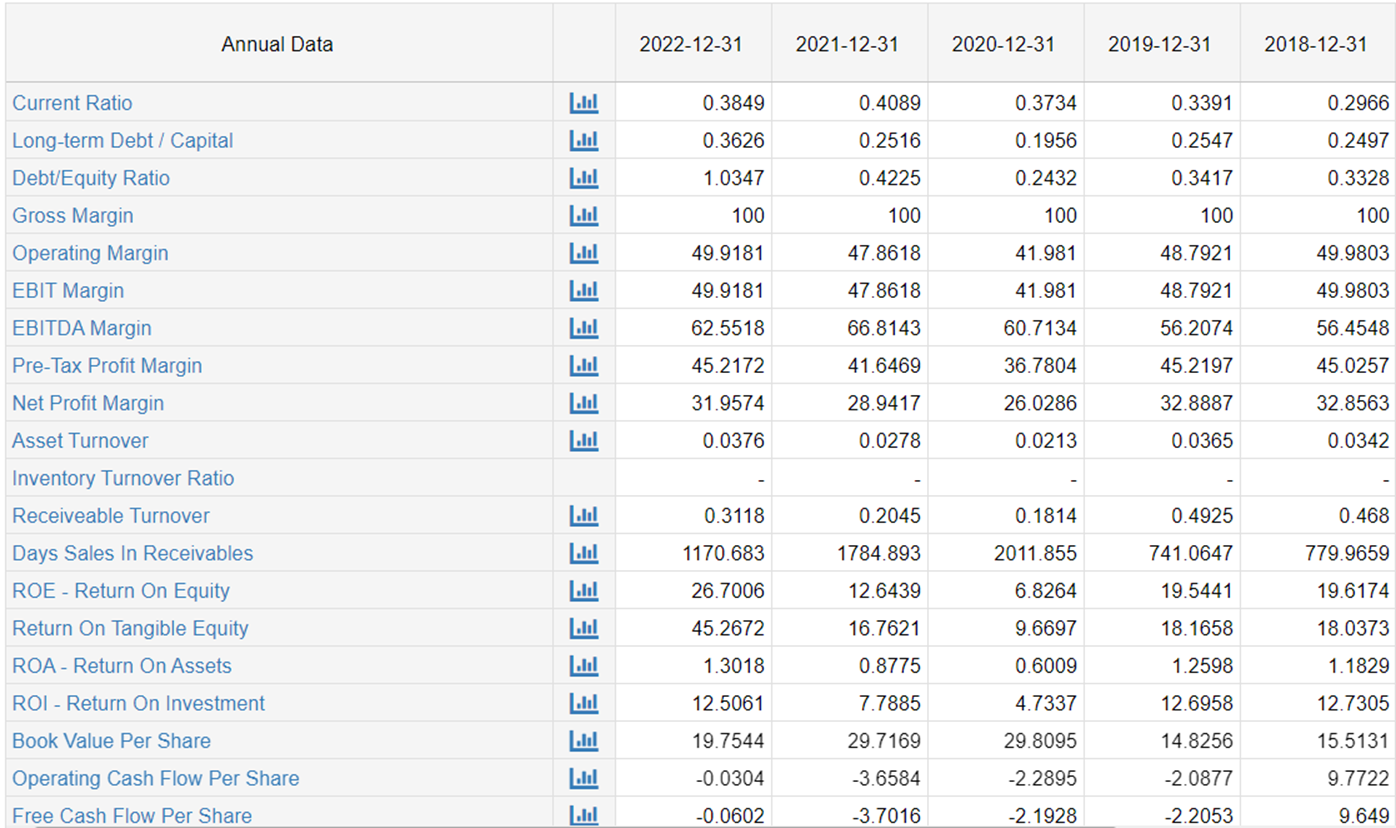
Annual Data | Millions of US $ except per share data 2022-12-31 2021-12-31 2020-12-31 2019-12-31 2018-12-31 Revenue $20,762 $18,520 $11,691 $10,721 $10, 132 Cost Of Goods Sold Gross Profit $20,762 $18,520 $11,691 $10,721 $10, 132 Research And Development Expenses SG&A Expenses $9, 150 $8,492 $6, 179 $5, 141 $4,762 Other Operating Income Or Expenses Lolil Operating Expenses Operating Income $10,364 $8,864 $4,908 $5,231 $5,064 Total Non-Operating Income/Expense $-976 $-1, 151 $-608 S-383 $-502 Pre-Tax Income $9,388 $7,713 $4,300 $4,848 $4,562 Income Taxes Lalil $2,205 $1,858 $1,001 $1,144 $1,055 Income After Taxes Lalil $7, 183 $5,855 $3,299 $3,704 $3,507 Other Income Income From Continuous Operations $7, 183 $5,855 $3,299 $3,704 $3,507 Income From Discontinued Operations Net Income $6,635 $5,360 $3,043 $3,526 $3,329 EBITDA $12,987 $12,374 $7,098 $6,026 $5,720 EBIT $10,364 $8,864 $4,908 $5,231 $5,064 Basic Shares Outstanding Lolil 1,885 1,887 1,429 1,311 1,348 Shares Outstanding L.ul 1,894 1,897 1,435 1,320 1,361 Basic EPS $3.52 $2.84 $2.13 $2.69 $2.47 EPS - Earnings Per Share $3.50 $2.83 $2.12 $2.67 $2.45Annual Data | Millions of US $ except per share data Cash On Hand Receivables Inventory Pre-Paid Expenses Other CurrentAssets Total Current Assets Property. Plant. And Equipment Long-Term Investments Goodwill And Intangible Assets Other Long-Term Assets Total Long-Term Assets Total Assets Total Current Liabilities Long Term Debt Other Non-Current Liabilities Total Long Term Liabilities Total Liabilities Common Stock Net Retained Earnings (Accumulated Deficit) Comprehensive Income Other Share Holders Equity Share Holder Equity Total Liabilities And Share Holders Equity EEEEEE EEEE :E 20221231 $83,178 $107,098 $190,274 $3,714 $320,945 $20,740 $18,099 $381,498 $551,772 $494,338 $20,828 $20,828 $515,164 $21 $31,088 $22,821 $36,808 $551,772 20211231 $118,924 $125,201 $242,125 $3,442 $390,054 $21,331 $10,318 $425,145 $667,270 $592,095 $18,914 $18,914 $611,009 $21 $25,992 $1,109 $56,261 $667,270 20201231 $90,747 $88,253 $179,000 $2,883 $337,400 $21,943 $7,783 $370,009 $549,009 $479,317 $13,832 $13,832 $492,949 $21 $21,975 $5,394 $56,080 $549,009 20191231 $49,828 $39,979 $89,807 $2,128 $198,128 $1,355 $4,587 $204,198 $294,005 $284,830 $7,430 $7,430 $272,260 $15 $19,980 $88 $21,745 $294,005 20181231 $41,501 $38,280 $79,781 $1,789 $210,587 $1,227 $3,138 $218,721 $296,482 $288,934 $8,878 $8,878 $275,812 $15 $17,329 8252 $20,870 $296,482 Annual Data | Millions of US $ except per share data 2022-12-31 2021-12-31 2020-12-31 2019-12-31 2018-12-31 Net Income/Loss $7, 183 $5,855 $3,299 $3,704 $3,507 Total Depreciation And Amortization - Cash Flow $2,623 $3,510 $2, 190 $795 $656 Other Non-Cash Items $348 $307 $66 $185 $7, 168 Total Non-Cash Items $2,971 $3,817 $2,256 $980 $7,824 Change In Accounts Receivable $23,947 $-26, 168 $-14,609 $-125 $-1, 100 Change In Inventories $-874 $-3,398 $-10,208 $-977 Change In Accounts Payable $-28,233 $21,470 $22,909 $6, 494 $1,483 Change In Assets/Liabilities $-3,427 $170 $2,856 $-950 $605 Total Change In Assets/Liabilities $-8,587 $-7,926 $948 $4,442 $988 Cash Flow From Operating Activities $2,057 $2, 118 $6,852 $9,325 $12,456 Net Change In Property, Plant, And Equipment $-971 $-916 $-631 $-708 $-570 Net Change In Intangible Assets Net Acquisitions/Divestitures Lalil $14,748 Net Change In Short-term Investments Net Change In Long-Term Investments $38,943 $-63,759 $-134,308 $14,458 $-39,760 Net Change In Investments - Total $38,943 $-63,759 $-134,308 $14,458 $-39,760 Investing Activities - Other $-5,924 $-10,988 $-5,660 $-1,786 $-225 Cash Flow From Investing Activities $32,048 $-75,663 $-125,851 $11,964 $-40,555 Net Long-Term Debt $1,935 $5,214 $2,370 $593 $2, 115 Net Current Debt $12, 191 $4,852 $-15,000 Debt Issuance/Retirement Net - Total $14, 126 $10,066 $2,370 $593 $-12,885 Net Common Equity Issued/Repurchased $-2,591 $3,027 $5,019 $-2, 102 $-875 Net Total Equity Issued/Repurchased $-3,591 $2,427 $5,019 $-2, 102 $-875 Total Common And Preferred Stock Dividends Paid $-2, 110 $-1,822 $-1,280 $-1,060 $-787 Financial Activities - Other $-77, 148 $85,652 $137,873 $-11,370 $61,713 Cash Flow From Financial Activities $-68,723 $96,323 $143,982 $-13,939 $47, 166 Net Cash Flow $-34,618 $22,778 $24,983 $7,350 $19,067 Stock-Based Compensation $366 $254 $204 $183 $197Annual Data 2022-12-31 2021-12-31 2020-12-31 2019-12-31 2018-12-31 Current Ratio 0.3849 0.4089 0.3734 0.3391 0.2966 Long-term Debt / Capital 0.3626 0.2516 0. 1956 0.2547 0.2497 Debt/Equity Ratio 1.0347 0.4225 0.2432 0.3417 0.3328 Gross Margin 100 100 100 100 100 Operating Margin 49.9181 47.8618 41.981 48.7921 49.9803 EEEEEE EBIT Margin 49.9181 47.8618 41.981 48.7921 49.9803 EBITDA Margin 62.5518 66.8143 60.7134 56.2074 56.4548 Pre-Tax Profit Margin 45.2172 41.6469 36.7804 45.2197 45.0257 Net Profit Margin 31.9574 28.9417 26.0286 32.8887 32.8563 Asset Turnover 0.0376 0.0278 0.0213 0.0365 0.0342 Inventory Turnover Ratio Receiveable Turnover 0.3118 0.2045 0.1814 0.4925 0.468 Days Sales In Receivables 1170.683 1784.893 2011.855 741.0647 779.9659 ROE - Return On Equity 26.7006 12.6439 6.8264 19.5441 19.6174 Return On Tangible Equity 45.2672 16.7621 9.6697 18.1658 18.0373 EEEE ROA - Return On Assets 1.3018 0.8775 0.6009 1.2598 1.1829 ROI - Return On Investment 12.5061 7.7885 4.7337 12.6958 12.7305 Book Value Per Share 19.7544 29.7169 29.8095 14.8256 15.5131 Operating Cash Flow Per Share -0.0304 -3.6584 -2.2895 -2.0877 9.7722 Free Cash Flow Per Share Lahl -0.0602 -3.7016 -2. 1928 -2.2053 9.649


