

Answered step by step
Verified Expert Solution
Question
1 Approved Answer
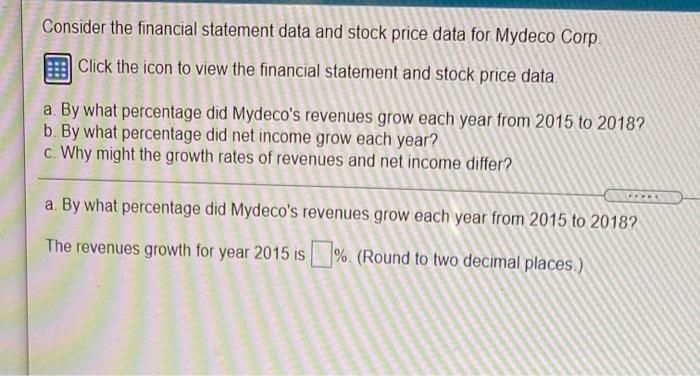
Consider the financial statement data and stock price data for Mydeco Corp Click the icon to view the financial statement and stock price data a.
Step by Step Solution
There are 3 Steps involved in it
Step: 1

Get Instant Access to Expert-Tailored Solutions
See step-by-step solutions with expert insights and AI powered tools for academic success
Step: 2

Step: 3
Ace Your Homework with AI
Get the answers you need in no time with our AI-driven, step-by-step assistance
Get Started
Financial Markets And Institutions
Authors: Jeff Madura
8th Edition
0324568215, 978-0324568219