

Question
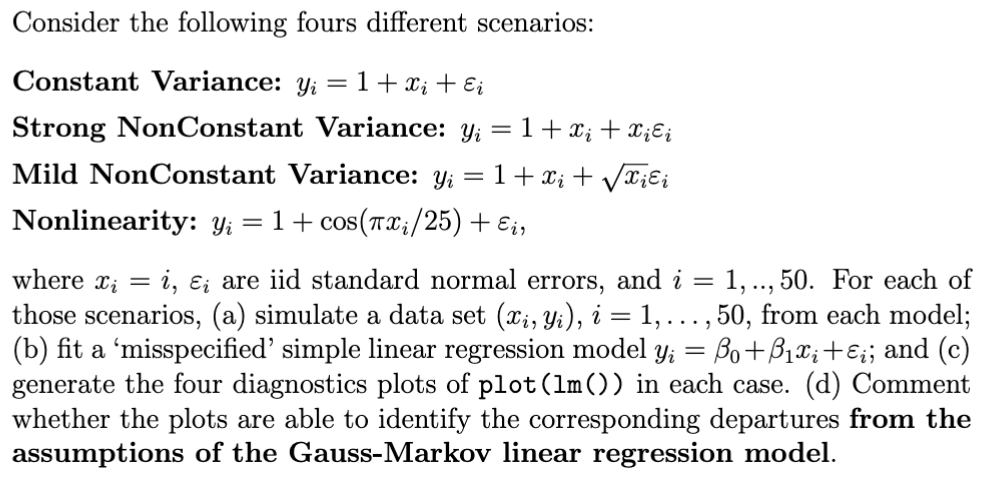
Consider the following fours different scenarios: Constant Variance: y_(i)=1+x_(i)+epsi _(i) Strong NonConstant Variance: y_(i)=1+x_(i)+x_(i)epsi _(i) Mild NonConstant Variance: y_(i)=1+x_(i)+sqrt(x_(i))epsi _(i) Nonlinearity: y_(i)=1+cos(pi
Consider the following fours different scenarios:\ Constant Variance:
y_(i)=1+x_(i)+\\\\epsi _(i)\ Strong NonConstant Variance:
y_(i)=1+x_(i)+x_(i)\\\\epsi _(i)\ Mild NonConstant Variance:
y_(i)=1+x_(i)+\\\\sqrt(x_(i))\\\\epsi _(i)\ Nonlinearity:
y_(i)=1+cos(\\\\pi (x_(i))/(25))+\\\\epsi _(i),\ where
x_(i)=i,\\\\epsi _(i)are iid standard normal errors, and
i=1,..,50. For each of\ those scenarios, (a) simulate a data set
(x_(i),y_(i)),i=1,dots,50, from each model;\ (b) fit a 'misspecified' simple linear regression model
y_(i)=\\\\beta _(0)+\\\\beta _(1)x_(i)+\\\\epsi _(i); and (c)\ generate the four diagnostics plots of
plot(lm())in each case. (d) Comment\ whether the plots are able to identify the corresponding departures from the\ assumptions of the Gauss-Markov linear regression model.
Step by Step Solution
There are 3 Steps involved in it
Step: 1

Get Instant Access to Expert-Tailored Solutions
See step-by-step solutions with expert insights and AI powered tools for academic success
Step: 2

Step: 3
Ace Your Homework with AI
Get the answers you need in no time with our AI-driven, step-by-step assistance
Get Started
Methane Conversion Routes Status And Prospects
Authors: Vladimir Galvita, René Bos
1st Edition
1788014308, 978-1788014304