

Answered step by step
Verified Expert Solution
Question
1 Approved Answer
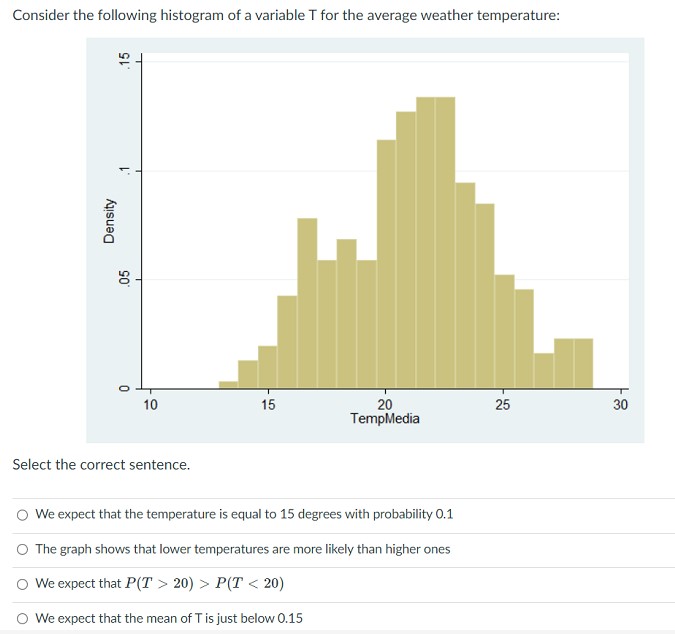
Consider the following histogram of a variable T for the average weather temperature: Density 8 - 10 15 20 25 30 TempMedia Select the correct
Step by Step Solution
There are 3 Steps involved in it
Step: 1

Get Instant Access to Expert-Tailored Solutions
See step-by-step solutions with expert insights and AI powered tools for academic success
Step: 2

Step: 3
Ace Your Homework with AI
Get the answers you need in no time with our AI-driven, step-by-step assistance
Get Started
Linear Algebra With Applications
Authors: Gareth Williams, Williams
9th Edition
1284120104, 9781284120103