Question
A group of people are asked to target weighing out 75 lbs for each sample. There were 78 people who participated in this study. The
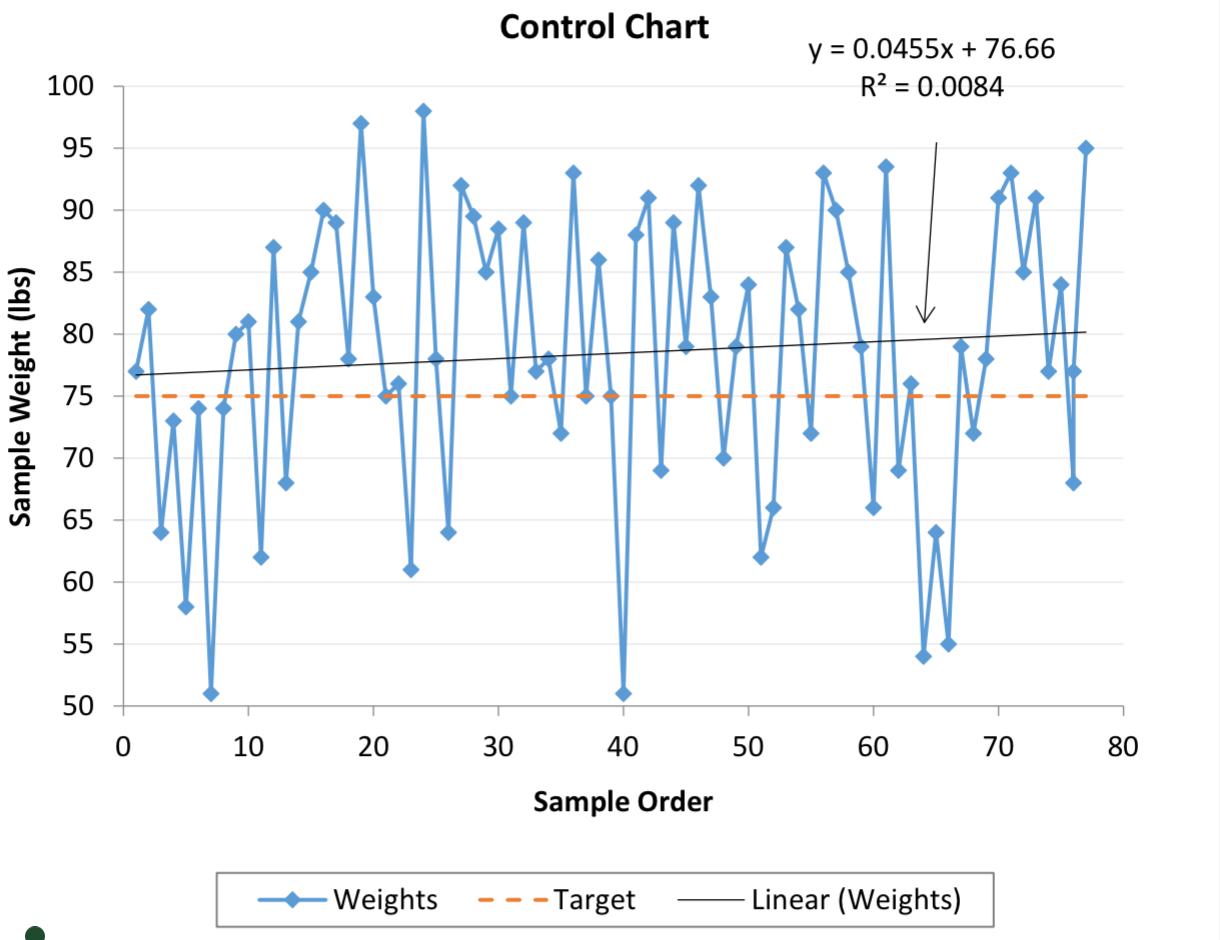
A group of people are asked to target weighing out 75 lbs for each sample. There were 78 people who participated in this study. The next page shows a control chart of their measurements. The average of the data is 78.46 lbs and the standard deviation was found to be 11.24 lbs. You are asked to interpret the results of a t-test and interpret control charts (see below), specifically as follows:
a) What does a t-test tell you about whether the target weight is the same as the group average weight? A two-sided t-table value for an alpha of 0.01 is 0.992. (6 points) Show your t-test
calculations for full credit.
b) What is the coefficient of variation? (2 points)
c) Statistically-speaking, determine if there are any outliers in the control chart below. If so, please indicate which ones by indicating roughly the sample order number(s)
d)Which can you say is true about the data above and from the previous page? (4 points)
□ The coefficient of variation is used to test the data for accuracy.
□ The coefficient of variation is used to test the data for precision.
□ The t-test is used to test the data for precision.
□ The t-test is used to test the data for accuracy

Sample Weight (lbs) 100 95 90 85 80 75 70 65 60 55 50 0 10 20 Weights Control Chart 30 40 Sample Order - - Target 50 y = 0.0455x + 76.66 R = 0.0084 60 Linear (Weights) 70 80
Step by Step Solution
3.48 Rating (151 Votes )
There are 3 Steps involved in it
Step: 1
a A ttest is used to determine if there is a significant difference between the group average weight and the target weight In this case the target wei...
Get Instant Access to Expert-Tailored Solutions
See step-by-step solutions with expert insights and AI powered tools for academic success
Step: 2

Step: 3

Ace Your Homework with AI
Get the answers you need in no time with our AI-driven, step-by-step assistance
Get Started


