

Question: Consider the following model of a variable rate source shown in the figure below. State 0 corresponds to 2 Mbits/s and state 1 to 5
Consider the following model of a variable rate source shown in the figure below. State 0 corresponds to 2 Mbits/s and state 1 to 5 Mbits/s.
PLEASE SHOW ALL THE STEPS.
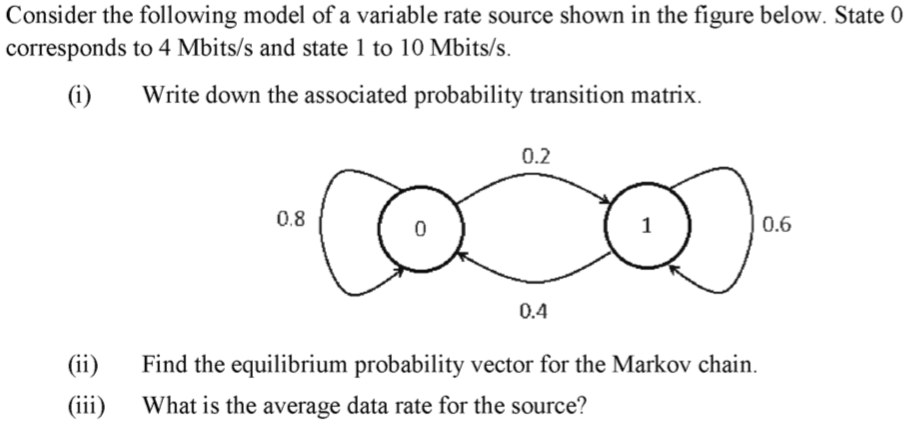
Consider the following model of a variable rate source shown in the figure below. State 0 corresponds to 4 Mbits/s and state 1 to 10 Mbits/s. (i)Write down the associated probability transition matrix 0.2 0.8 0.6 0.4 i) Find the equilibrium probability vector for the Markov chain. (iii) What is the average data rate for the source
Step by Step Solution
There are 3 Steps involved in it
1 Expert Approved Answer
Step: 1 Unlock

Question Has Been Solved by an Expert!
Get step-by-step solutions from verified subject matter experts
Step: 2 Unlock
Step: 3 Unlock