

Question
Consider the following stocks, see the table below , all of which will pay a liquidating dividend one year from now and nothing in the
Consider the following stocks, see the table below , all of which will pay a liquidating dividend one year from now and nothing in the interim. Assume the risk-free rate is 4% and the market risk premium is 8%.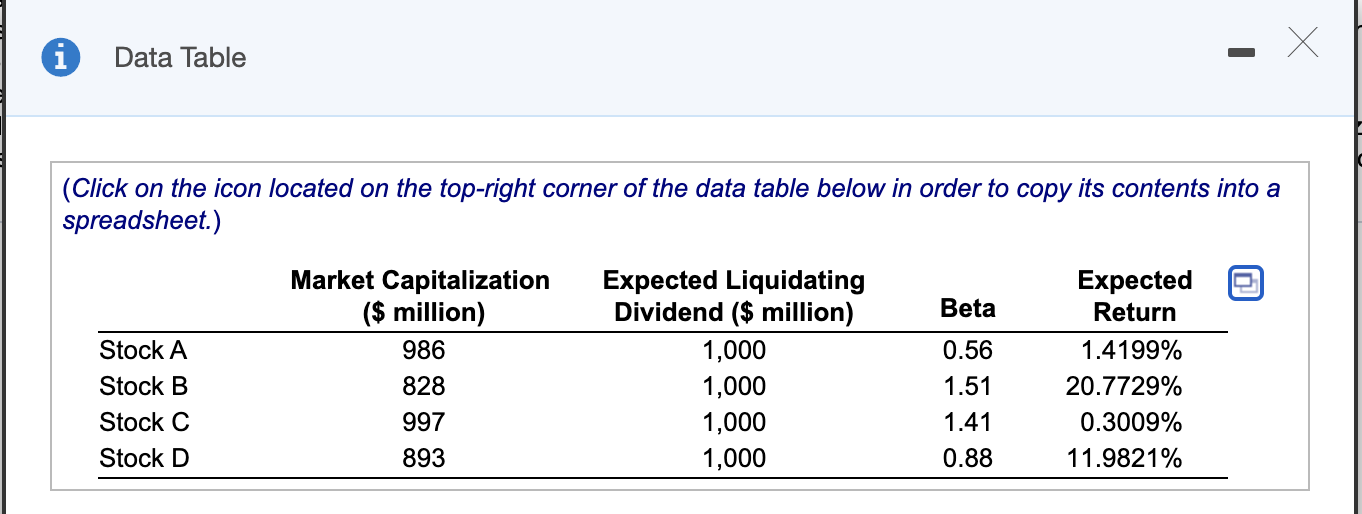
a. What does the CAPM predict the expected return for each stock should be?
According to CAPM, the expected return for stock A is .............%. (Round to four decimal places.)
According to CAPM, the expected return for stock B is .............%. (Round to four decimal places.)
According to CAPM, the expected return for stock C is .............%. (Round to four decimal places.)
According to CAPM, the expected return of stock D is ..............%. (Round to four decimal places.)
b. Clearly, the CAPM predictions are not equal to the actual expected returns, so the CAPM does not hold. You decide to investigate this further. To see what kind of mistakes the CAPM is making, you decide to regress the actual expected return onto the expected return predicted by the CAPM. What is the intercept and slope coefficient of this regression?
The slope coefficient of this regression is ............... (Round to six decimal places.)
The intercept of this regression is ...........%. (Round to four decimal places.)
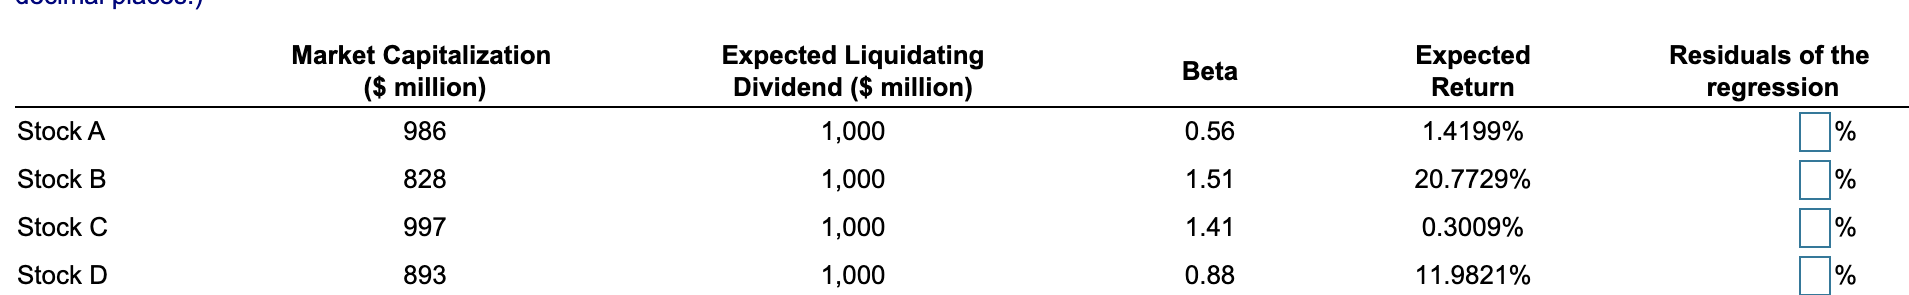
c. What are the residuals of the regression in part (b)? That is, for each stock compute the difference between the actual expected return and the best fitting line given by the intercept and slope coefficient in part (b).
For each stock compute the difference between the actual expected return and the best fitting line given by the intercept and slope coefficient in (b). (Round to four decimal places.)
d. What is the sign of correlation between the residuals you calculated in part (c) and market capitalization?
The correlation between the residuals you calculated in part (c) and market capitalization is ................. (Round to six decimal places.)
e. What can you conclude from your answers to part (b) of the previous problem and part (d) of this problem about the relation between firm size (market capitalization) and returns? (The results do not depend on the particular numbers in this problem. You are welcome to verify this for yourself by redoing the problems with another value for the market risk premium, and by picking the stock betas and market capitalizations randomly.)(Select the best choice below.)
A.You cannot tell definitively.
B.The numbers would change, but their signs would remain the same.
C.The numbers would remain the same, but the signs might change.
D.They would not change at all.
1 Data Table (Click on the icon located on the top-right corner of the data table below in order to copy its contents into a spreadsheet.) Beta Stock A Stock B Stock C Stock D Market Capitalization ($ million) 986 828 997 Expected Liquidating Dividend ($ million) 1,000 1,000 1,000 1,000 0.56 1.51 1.41 0.88 Expected Return 1.4199% 20.7729% 0.3009% 11.9821% 893 Beta Market Capitalization ($ million) 986 Expected Liquidating Dividend ($ million) 1,000 Expected Return Residuals of the regression % Stock A 0.56 1.4199% Stock B 828 1,000 1.51 20.7729% % Stock C 997 1,000 1.41 0.3009% % Stock D 893 1,000 0.88 11.9821% % 1 Data Table (Click on the icon located on the top-right corner of the data table below in order to copy its contents into a spreadsheet.) Beta Stock A Stock B Stock C Stock D Market Capitalization ($ million) 986 828 997 Expected Liquidating Dividend ($ million) 1,000 1,000 1,000 1,000 0.56 1.51 1.41 0.88 Expected Return 1.4199% 20.7729% 0.3009% 11.9821% 893 Beta Market Capitalization ($ million) 986 Expected Liquidating Dividend ($ million) 1,000 Expected Return Residuals of the regression % Stock A 0.56 1.4199% Stock B 828 1,000 1.51 20.7729% % Stock C 997 1,000 1.41 0.3009% % Stock D 893 1,000 0.88 11.9821% %Step by Step Solution
There are 3 Steps involved in it
Step: 1

Get Instant Access to Expert-Tailored Solutions
See step-by-step solutions with expert insights and AI powered tools for academic success
Step: 2

Step: 3
Ace Your Homework with AI
Get the answers you need in no time with our AI-driven, step-by-step assistance
Get Started
Aat Management Accounting Budgeting
Authors: BPP Learning Media
1st Edition
1509718400, 978-1509718405