

Answered step by step
Verified Expert Solution
Question
1 Approved Answer
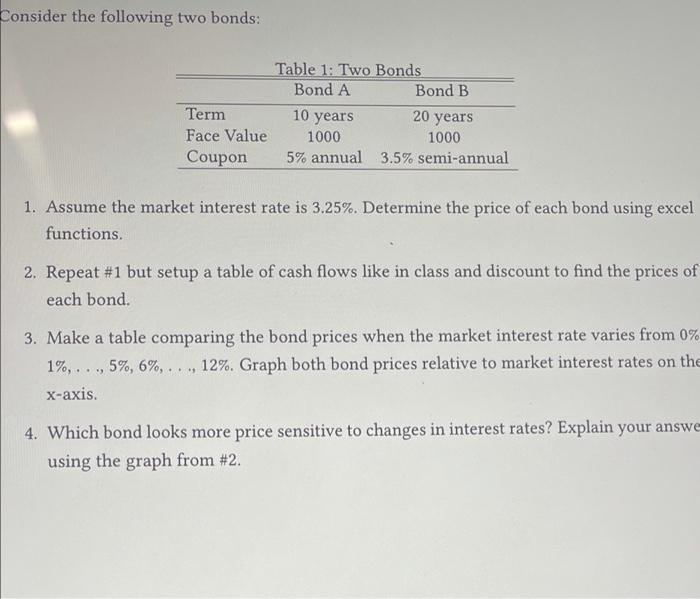
Consider the following two bonds: Table 1: Two Bonds Bond A Bond B Term Face Value 1000 1000 Coupon 5% annual 3.5% semi-annual 10 years
Step by Step Solution
There are 3 Steps involved in it
Step: 1

Get Instant Access to Expert-Tailored Solutions
See step-by-step solutions with expert insights and AI powered tools for academic success
Step: 2

Step: 3
Ace Your Homework with AI
Get the answers you need in no time with our AI-driven, step-by-step assistance
Get Started
States And The Reemergence Of Global Finance
Authors: Eric Helleiner
1st Edition
0801428599, 978-0801428593