

Answered step by step
Verified Expert Solution
Question
1 Approved Answer
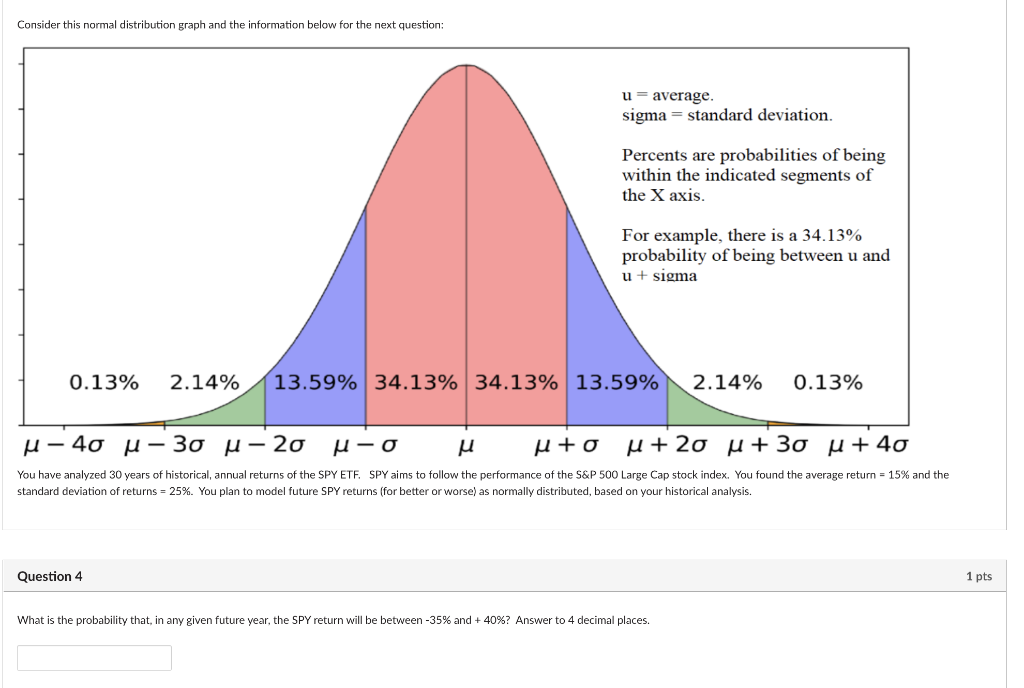
Consider this normal distribution graph and the information below for the next question: You have analyzed 30 years of historical, annual returns of the SPY
Step by Step Solution
There are 3 Steps involved in it
Step: 1

Get Instant Access to Expert-Tailored Solutions
See step-by-step solutions with expert insights and AI powered tools for academic success
Step: 2

Step: 3
Ace Your Homework with AI
Get the answers you need in no time with our AI-driven, step-by-step assistance
Get Started
The Handbook Of Professionally Managed Assets A Definitive Guide To Profiting From Alternative Investments
Authors: Keith Fevurly
1st Edition
143026019X, 978-1430260196