Answered step by step
Verified Expert Solution
Link Copied!

Question

1 Approved Answer

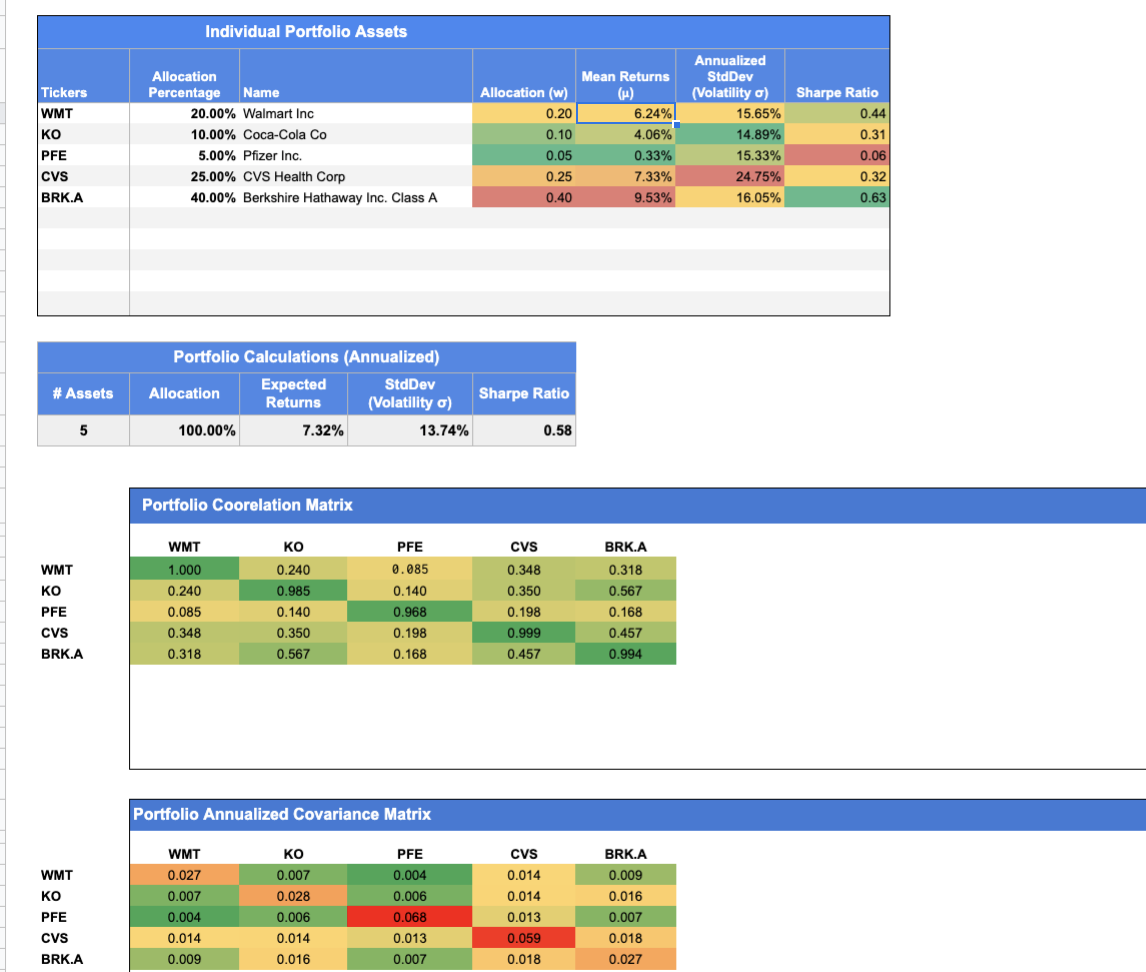
Considering the attached set of securities and portfolio returns: Assume that you initially invested $1,000,000 in the portfolio and that the distribution of the annual

Considering the attached set of securities and portfolio returns:

  1. Assume that you initially invested $1,000,000 in the portfolio and that the distribution of the annual rate of return of the portfolio is normal.
    1. What is the distribution of the return of the portfolio 20 years after its formation?
    2. Provide the graph of the distribution of the return of the portfolio.image text in transcribed
Individual Portfolio Assets Tickers WMT KO PFE Allocation Percentage Name 20.00% Walmart Inc 10.00% Coca-Cola Co 5.00% Pfizer Inc. 25.00% CVS Health Corp 40.00% Berkshire Hathaway Inc. Class A Allocation (w) 0.20 0.10 0.05 0.25 0.40 Mean Returns (u) 6.24% 4.06% 0.33% 7.33% 9.53% Annualized Std Dev (Volatility o) 15.65% 14.89% 15.33% 24.75% 16.05% Sharpe Ratio 0.44 0.31 0.06 0.32 0.63 CVS BRK.A # Assets Portfolio Calculations (Annualized) StdDev Allocation Expected Returns (Volatility o) 100.00% 7.32% 13.74% Sharpe Ratio 5 0.58 Portfolio Coorelation Matrix KO CVS WMT KO WMT 1.000 0.240 0.085 0.348 0.318 PFE 0.085 0.140 0.968 0.198 0.168 0.240 0.985 0.140 0.350 0.567 PFE CVS BRK.A BRK.A 0.318 0.567 0.168 0.457 0.994 0.348 0.350 0.198 0.999 0.457 Portfolio Annualized Covariance Matrix WMT KO PFE CVS BRK.A WMT 0.027 0.007 0.004 0.014 0.009 KO 0.007 0.028 0.006 0.014 0.016 PFE 0.004 0.006 0.068 0.013 0.007 CVS 0.014 0.014 0.013 0.059 0.018 BRKA 0.009 0.016 0.007 0.018 0.027 Individual Portfolio Assets Tickers WMT KO PFE Allocation Percentage Name 20.00% Walmart Inc 10.00% Coca-Cola Co 5.00% Pfizer Inc. 25.00% CVS Health Corp 40.00% Berkshire Hathaway Inc. Class A Allocation (w) 0.20 0.10 0.05 0.25 0.40 Mean Returns (u) 6.24% 4.06% 0.33% 7.33% 9.53% Annualized Std Dev (Volatility o) 15.65% 14.89% 15.33% 24.75% 16.05% Sharpe Ratio 0.44 0.31 0.06 0.32 0.63 CVS BRK.A # Assets Portfolio Calculations (Annualized) StdDev Allocation Expected Returns (Volatility o) 100.00% 7.32% 13.74% Sharpe Ratio 5 0.58 Portfolio Coorelation Matrix KO CVS WMT KO WMT 1.000 0.240 0.085 0.348 0.318 PFE 0.085 0.140 0.968 0.198 0.168 0.240 0.985 0.140 0.350 0.567 PFE CVS BRK.A BRK.A 0.318 0.567 0.168 0.457 0.994 0.348 0.350 0.198 0.999 0.457 Portfolio Annualized Covariance Matrix WMT KO PFE CVS BRK.A WMT 0.027 0.007 0.004 0.014 0.009 KO 0.007 0.028 0.006 0.014 0.016 PFE 0.004 0.006 0.068 0.013 0.007 CVS 0.014 0.014 0.013 0.059 0.018 BRKA 0.009 0.016 0.007 0.018 0.027

Step by Step Solution

There are 3 Steps involved in it

Step: 1

blur-text-image

Get Instant Access to Expert-Tailored Solutions

See step-by-step solutions with expert insights and AI powered tools for academic success

Step: 2

blur-text-image

Step: 3

blur-text-image

Ace Your Homework with AI

Get the answers you need in no time with our AI-driven, step-by-step assistance

Get Started

Students also viewed these Finance questions